
Most self-storage operators are not short of data. They have a property management system, a revenue-management engine, a rate-shop feed and a BI tool with forty dashboards. What they are short of is the sentence that tells a district manager at 7 a.m. which three things to fix today.
That sentence is what we call an AI insight. This post explains what one looks like, how Storage 360 produces a quarter of a million of them every night, and how they reach the right person as a brief or an alert instead of another dashboard tile.
Dashboards answer “what”. Operators need “so what”.
The demo portfolio has 401 stores, 58,616 units and 190,421 tenants across 36 months of history. Its headline numbers are healthy: occupancy 91.3%, revenue $140.9M over the last twelve months, NOI $86.1M, a 61.1% margin. A dashboard shows all of that well.
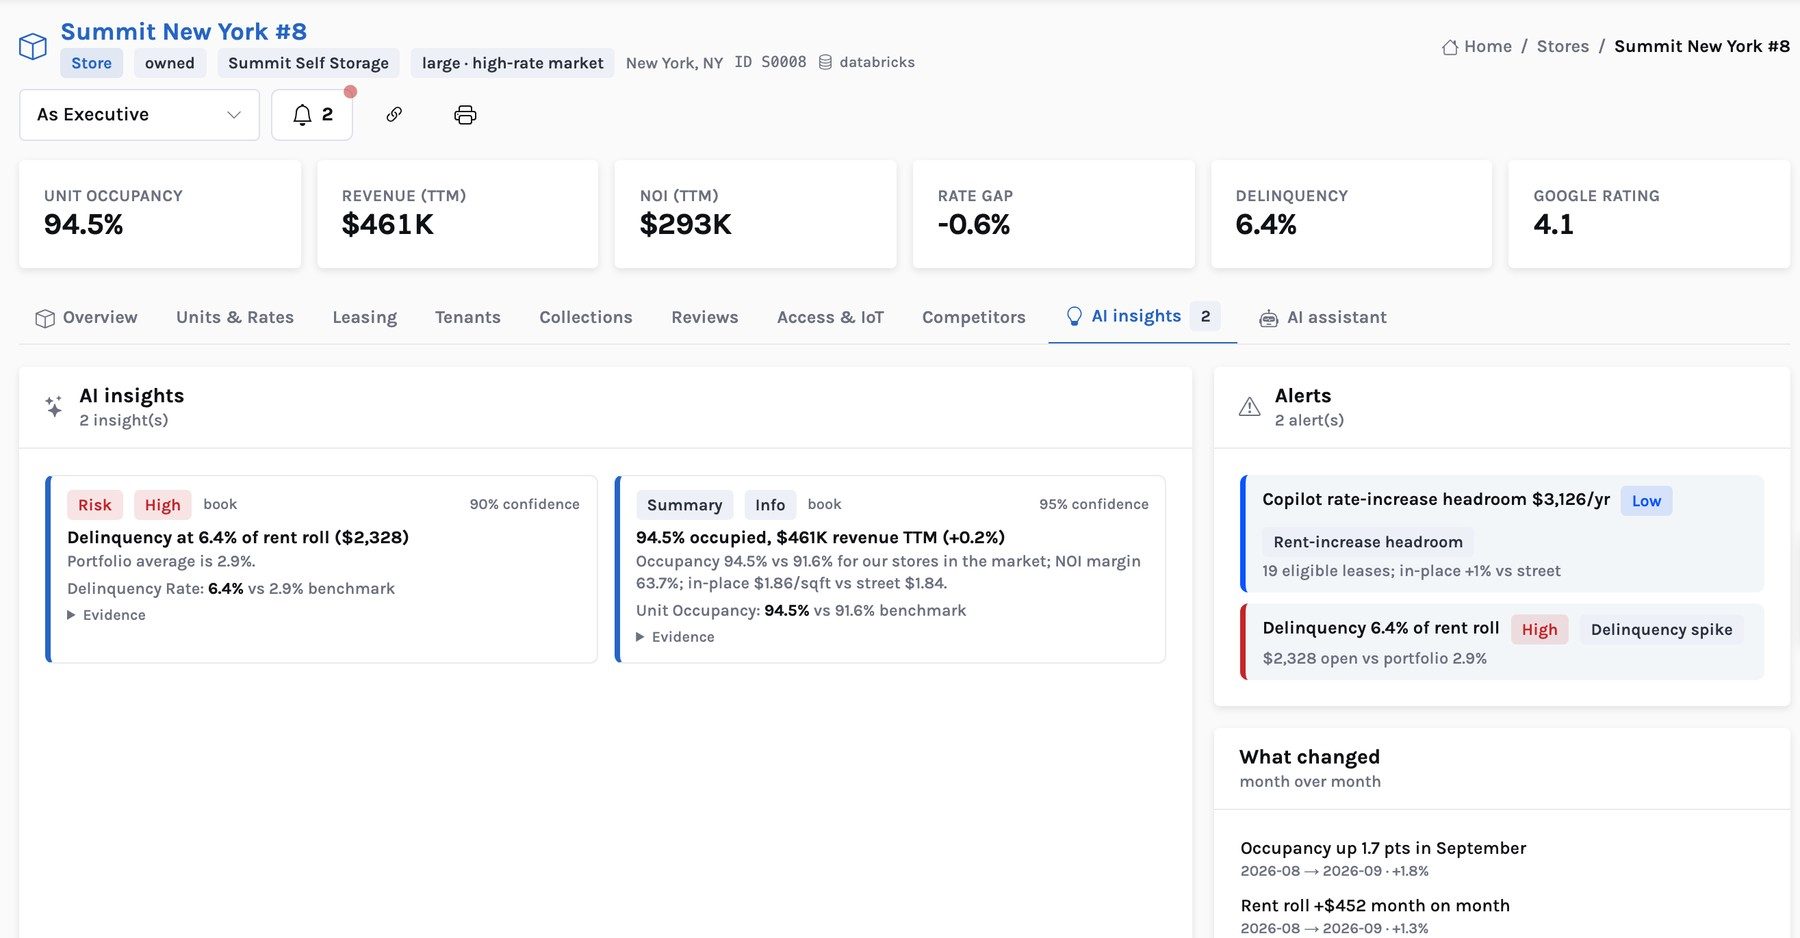
What it cannot show is that one New York store has delinquency at 6.4% of its rent roll against 2.9% for the portfolio; that 34 stores have units vacant long enough to need a price push; or that a management contract worth $85K a year in fees ends in three months. Those facts are in the data. Finding them means someone has to know where to look, every day, across 401 stores. Nobody does.
The anatomy of an insight
We hold every insight to the same six-part shape. If a part is missing, the insight is not finished.
- 1Finding. One sentence, with the number in it.
- 2Benchmark. Against the portfolio, the market or peers, so “high” means something.
- 3Confidence. How sure, and from which source: the book, market intelligence or the public company graph.
- 4Evidence. The rows behind the claim.
- 5What changed. The month-over-month movement.
- 6Action. The next step, with expected value where it can be computed.
Composite drawn from one demo store. On the live card, evidence expands in place and the change list sits beside it.
The finding is written as a headline that states the point: “Delinquency at 6.4% of rent roll”, not “Delinquency analysis”. The benchmark stops a number from floating free. The evidence is the part that earns trust: it records the tables, keys and values the insight was computed from, so an analyst can trace any claim back to the rows.
Insights are computed from the numbers on the page
An insight that disagrees with the KPI tile above it destroys trust in both. So Storage 360 computes insights from the same aggregates the pages display, and an automated validator checks that they agree. It is one of 268 automated data checks that run against the demo data.
Each insight is typed — risk, opportunity, trend, anomaly or summary — and carries a severity and a confidence. Every entity type has them: stores, tenants, units, markets, owners, campaigns, operators and districts. Across the demo portfolio that adds up to 251,241 insights, 12,480 recommendations and 1,283 open alerts.
The nightly loop
None of this runs when a user clicks. The heavy work happens once a night, then pages read cached results.
Next night, “what changed” shows whether yesterday's action moved the number.
The loop has a useful side effect: the “what changed” list. Because each night is compared with the last, a store manager sees that occupancy rose 1.7 points in September, or that the rent roll grew $452 month on month. Trend becomes visible without anyone building a trend report.
Alerts: the insights that should interrupt you
Most insights wait to be read. Alerts are the subset that should reach someone today. The demo has 1,283 open alerts across twelve types:
| Alert type | Open |
|---|---|
| Move-out risk | 868 |
| Street rate below market | 97 |
| Occupancy drop | 89 |
| Review dip | 50 |
| Delinquency spike | 49 |
| Long-vacant units | 34 |
| Rent-increase headroom | 31 |
| Competitor rate move | 24 |
| Cost per move-in | 18 |
| New supply | 16 |
| Management contract renewal | 6 |
| Owner NOI | 1 |
Move-out risk dominates because it is tenant-level: one alert per tenant likely to leave in the next 90 days. The others are store, market or owner level, and each is a short list a person can actually work.
Briefs: the same truth, cut by role
An executive, a revenue manager, a district manager and a marketing lead need different things from the same data. Storage 360 builds a morning brief for each: a short summary, the KPIs that role owns, and its alerts ranked by severity.
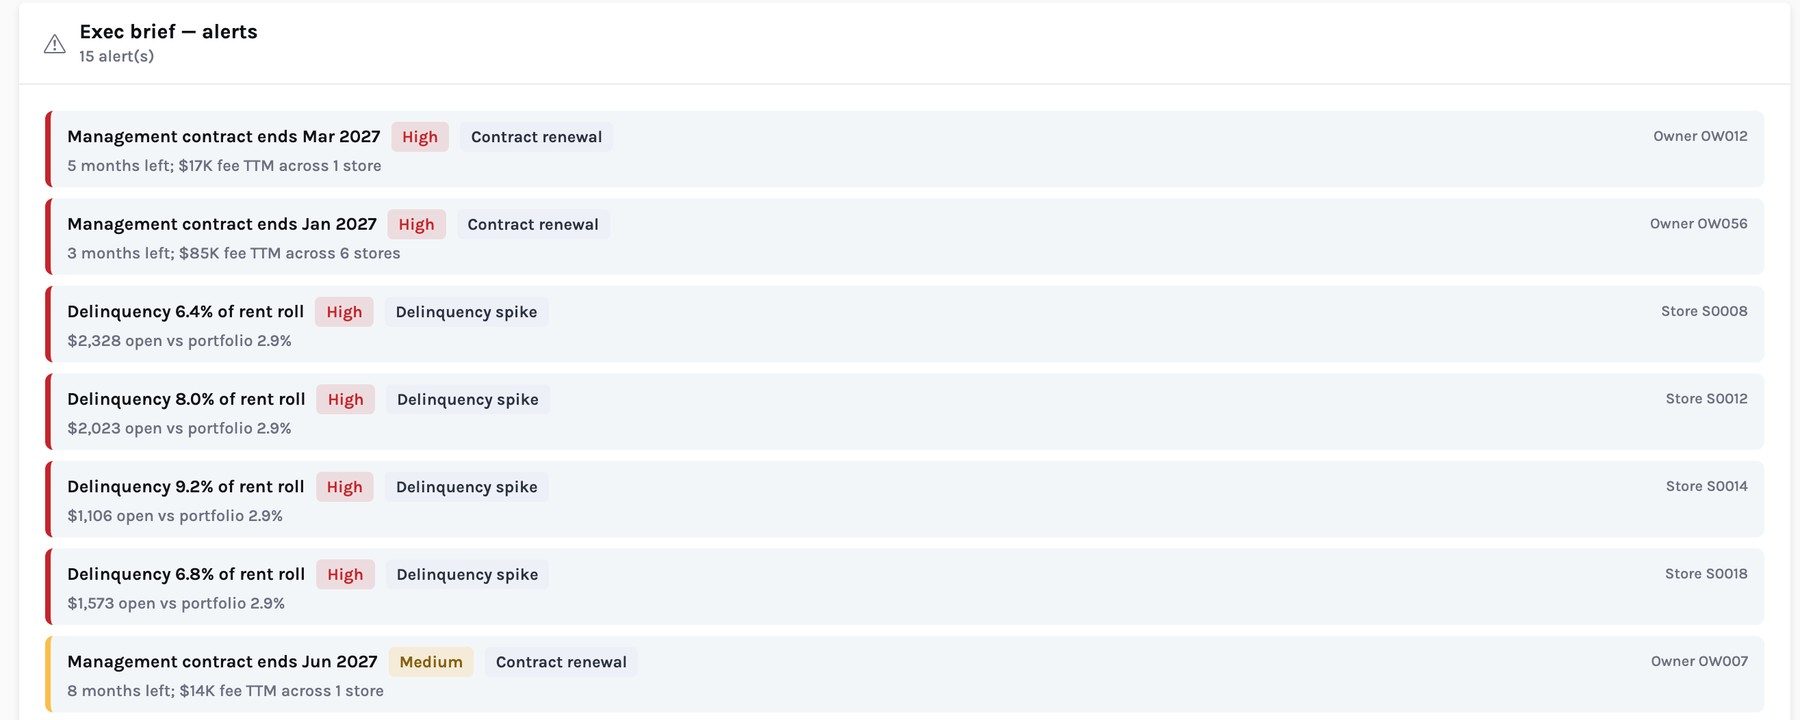
The executive brief above puts two contract renewals first — one ends in three months with $85K of fees across six stores — then the stores with delinquency spikes. Each row names the owner or store it belongs to, so the reader can open that 360 and go from “what” to “why”.
It is read-only. It recommends; your team applies rate changes, letters and collection steps in your PMS and revenue-management engine. That keeps the system of record where it is, and keeps a person between the AI and the tenant.
From dashboards to decisions
The shift is small to describe and large in practice. A dashboard waits for someone to ask the right question. An insight arrives with the question already answered, the evidence attached and the next step named. Multiply that by 401 stores and every role in the business, and the morning starts with work instead of with searching.
See the full product on the Storage 360 page, or read how the same discipline applies to pricing in explainable street-rate management.
Storage 360: AI-native revenue and operations intelligence for self-storage
The AI layer, the pricing and rent-increase logic, the lakehouse architecture and the 90-day pilot, in one PDF.