
Revenue-management engines are good at moving prices. They are poor at saying why. When a district manager cannot explain to a store team why a 10x10 went up $12, the store finds a promotion that takes it back. The model was right; the price did not stick.
Storage 360 takes a different stance on street rates. It recommends a move for every store and unit-type cell, and every recommendation carries its reason in plain words. This post walks through the four rules, the price index that anchors them, and what they found in the demo portfolio.
The unit of decision is the cell
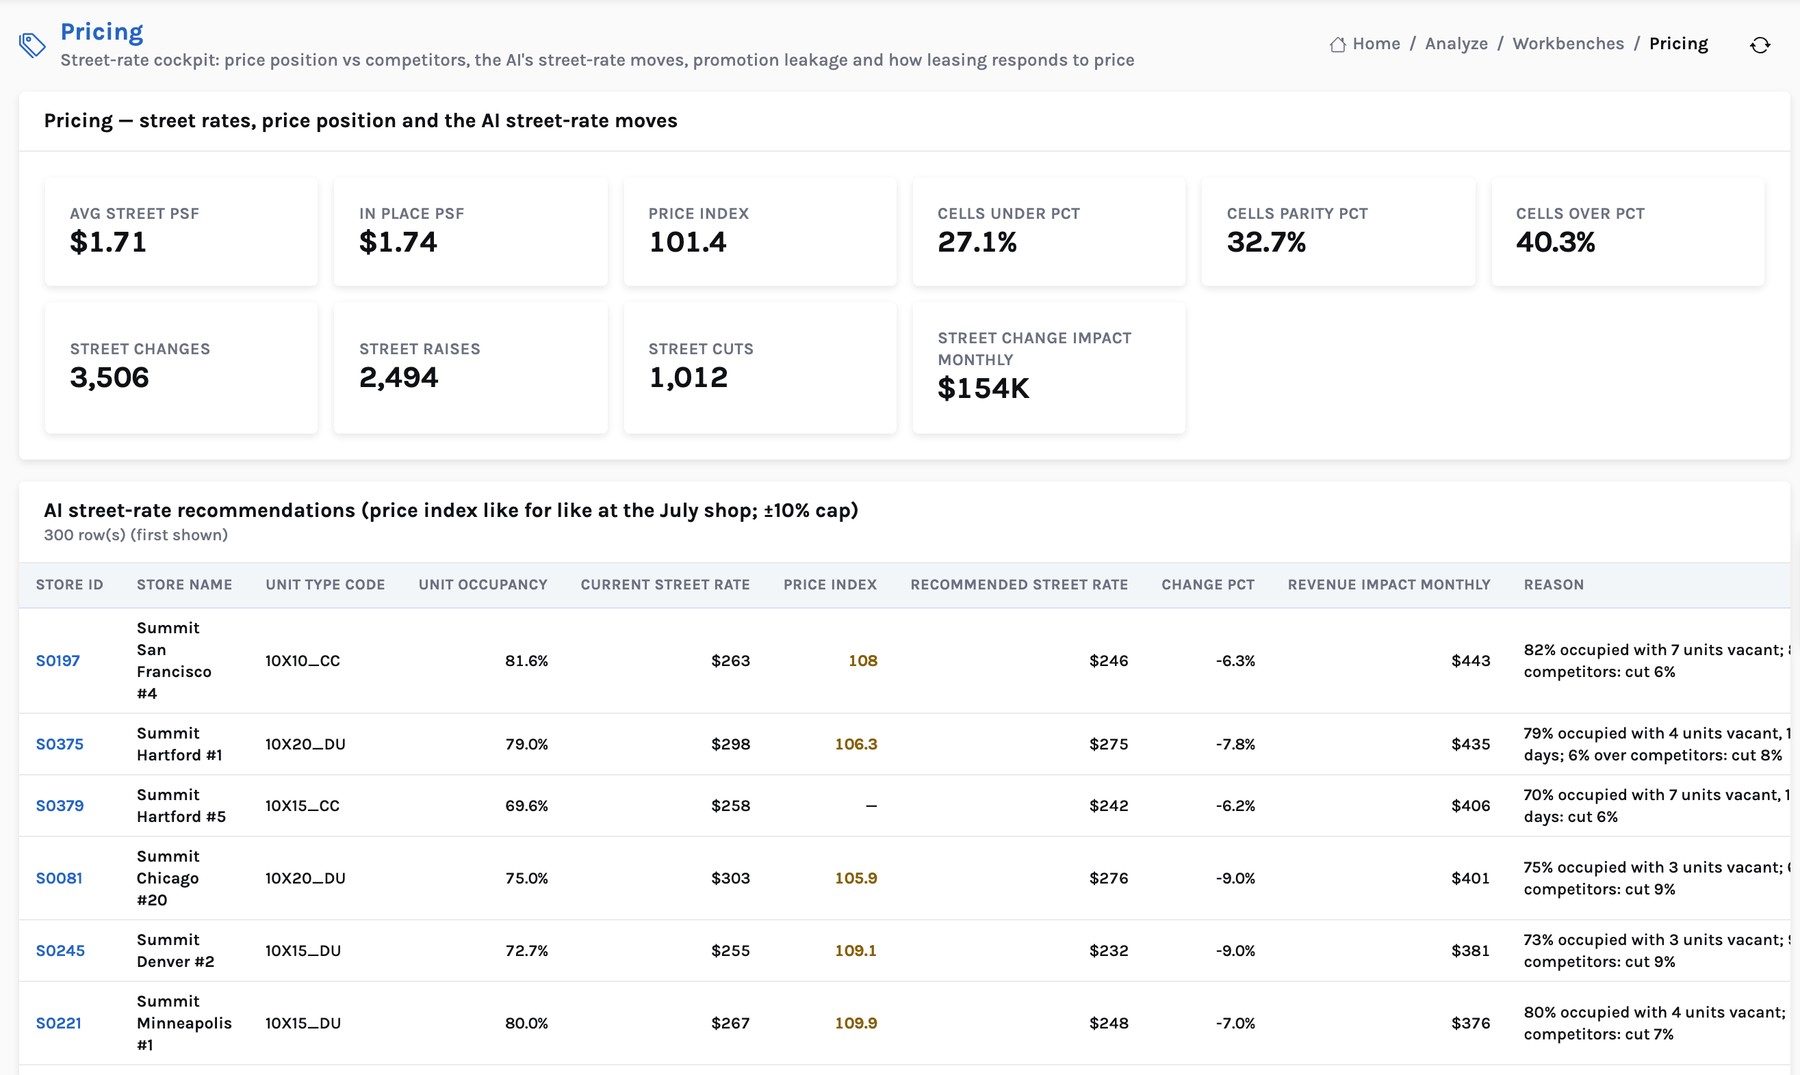
Street rates are set per store and unit type: a 10x10 climate-controlled unit in one store, a 10x20 drive-up in another. The demo portfolio has 5,379 such cells. Its average street rate is $1.71 per square foot a month, slightly below the $1.74 that existing tenants pay in place. That gap matters later, for rent increases.
Four rules, applied in order
1. Occupancy drives the direction
Occupancy is the clearest demand signal a store has. A cell that is nearly full can bear a higher street rate; a cell with many empty units cannot. The first rule sets the direction and size of the move from the cell's unit occupancy against a pivot of about 87%: a cell at 97% gets a raise of around 6%, a cell at 77% a cut of around 6%.
2. Aged vacancy adds a push
Occupancy alone treats a unit vacant for a week the same as one vacant for a season. The second rule counts units empty for more than 90 days. Where a cell is below 85% occupied and has two or more of them, it deepens the cut by a point for each, up to four points, so the long tail of empty units gets a price answer before it gets a promotion.
3. The competitor guard
A raise that takes a cell well above every competitor in the market is a raise the market will not pay. The third rule reads the cell's price index — our street rate against the average competitor rate for the same unit type in the same market — and adjusts in both directions. At 8% or more over the market, no raise. Between 3% and 8% over, a raise is held so the cell ends no more than 5% over. A full cell priced more than 5% under the market gets an extra raise. A cell already 8% under the market is not cut by more than 2%, and a weak cell priced over the market is cut a little further.
4. The ±10% cap
Large swings confuse customers and store teams, and a model is most likely to be wrong at the extremes. No recommendation moves a street rate more than 10% in either direction. Two more filters keep the list short: moves under 1% become holds, and so does any move that would lose money at the assumed price sensitivity of move-ins.
The price index anchors everything
The price index is the simplest useful number in self-storage pricing. 100 means our street rate equals the average competitor rate for the same unit type in the same market. Above 100 we are dearer; below, cheaper.
Demo portfolio, September 2026. Competitor rates in the demo are illustrative.
The portfolio index of 101.4 says Summit is, on average, priced in line with its markets. The split says the average hides a lot: 27% of cells are more than 3% under the market and 40% are more than 3% over it. Only a third are at parity. That spread is where the rate moves come from.
What the rules found
| Street-rate AI, demo portfolio | |
|---|---|
| Store × unit-type cells assessed | 5,379 |
| Cells with a recommended move | 3,506 |
| Raises | 2,494 |
| Cuts | 1,012 |
| Revenue impact per month | $154K |
| Revenue impact per year | ≈ $1.85M |
Two things stand out. First, the AI recommends cuts as well as raises — more than a thousand of them. A pricing tool that only ever raises is a revenue tool for this quarter and a vacancy problem for the next. Second, the cuts still contribute: a cut that fills a long-vacant unit earns more than a high rate on an empty one.
Reading one recommendation
Take a 10x20 drive-up cell at a Hartford store. It is 79% occupied with four units vacant, and its street rate of $298 sits at an index of 106.3 — about 6% above competitors. Rule one says cut, because occupancy is below the pivot. Rule three adds to the cut, because the cell is weak and over the market. The recommendation is $275, a 7.8% cut, worth about $435 a month once a year of move-ins has come in at the new rate. The reason column says it in one line: occupied, vacant, over competitors, cut 8%.
A revenue manager can disagree with that — perhaps a competitor is about to close — but she can see exactly what she is disagreeing with. That is the point of explainability: not that the AI is always right, but that a person can check it in seconds.
Street rates and promotions are one decision
In the last twelve months the demo portfolio gave away $4.46M in move-in discounts, on 45% of move-ins. Some of that bought demand that would not otherwise have come. Some of it went to stores that were already full. Looking at street rates without promotions misses half the price the tenant actually pays; Storage 360 puts both on the same page.
Where this sits beside your rate engine
Storage 360 does not push rates. If you run a revenue-management engine, it stays the system that sets prices. Storage 360 gives your team a second, explained view of every cell, flags the ones where the rules and the engine disagree, and shows the competitor position the engine may not see. The team decides; the engine executes.
Together with the rent-increase copilot, the street-rate moves add up to about $2.47M a year of pricing upside in the demo, around 1.8% of revenue. The Storage 360 page shows both workbenches; the next post covers rent increases without the move-out surprise.
Storage 360: AI-native revenue and operations intelligence for self-storage
The AI layer, the pricing and rent-increase logic, the lakehouse architecture and the 90-day pilot, in one PDF.