- contact@verticalserve.com

AI-native revenue and operations intelligence for self-storage. Every store, unit, tenant and market gets a 360 view. Every morning the AI says what changed, why it matters, and what to do next — from data that never leaves your Databricks lakehouse.
Figures from the Storage 360 synthetic demo portfolio, September 2026. Not a customer result.
A self-storage operator runs on a property management system, a revenue-management engine, a rate-shop feed and a BI tool. Each answers one question well. None tells a district manager at 7 a.m. which three things to fix today, or tells a revenue manager why a rate moved. Storage 360 reads all of them in place and turns them into ranked, explained actions.
The rate engine moves prices, but the reason sits in a model. Store teams cannot say why a 10x10 went up, so they discount around it.
Increase letters go out by tenure rule. The tenant already paying above street, with a recent increase and an open balance, gets the same letter as everyone else.
Rate-shop data lands as a spreadsheet. Nobody turns it into a like-for-like price index per store and unit type, so “are we cheap or expensive here?” has no answer.
Third-party owners want NOI, benchmarks and a plan. Asset managers build it by hand, every month, while contract renewals creep up.
What the AI layer found in the 401-store demo portfolio. Pricing alone is worth about $2.47M a year, roughly 1.8% of revenue.
2,494 raises and 1,012 cuts across 5,379 store × unit-type cells, worth $154K a month. Each move carries its reason: occupancy, vacancy age, competitor gap.
4,807 leases eligible for an increase. The copilot nets out tenants likely to leave, and 224 increases are capped by fairness rules before anyone sees them.
45% of move-ins came with a discount. Storage 360 shows which stores discount where occupancy is already high — money given away for demand that was coming anyway.
A prioritised queue by stage — late, pre-lien, lien, auction — with risk score, contact history and the next step for each account.
Tenants most likely to leave in 90 days, each with the reasons: paying above street, a recent increase, an open balance, short tenure.
AI-written owner reports with peer benchmarks for every third-party owner, and an alert when a management contract ends within 12 months.
All figures come from the Storage 360 synthetic demo portfolio (Summit Self Storage, fictional) as of September 2026. They show what the product computes, not a customer result. Competitor rates in the demo are illustrative.
An insight is not a chart. It is a sentence you can act on, with the benchmark, the evidence and the confidence beside it.
Composite drawn from the demo store above. On the live card the benchmark, evidence and change sit in the expandable panel and the What changed list; the action comes from the recommendations layer.
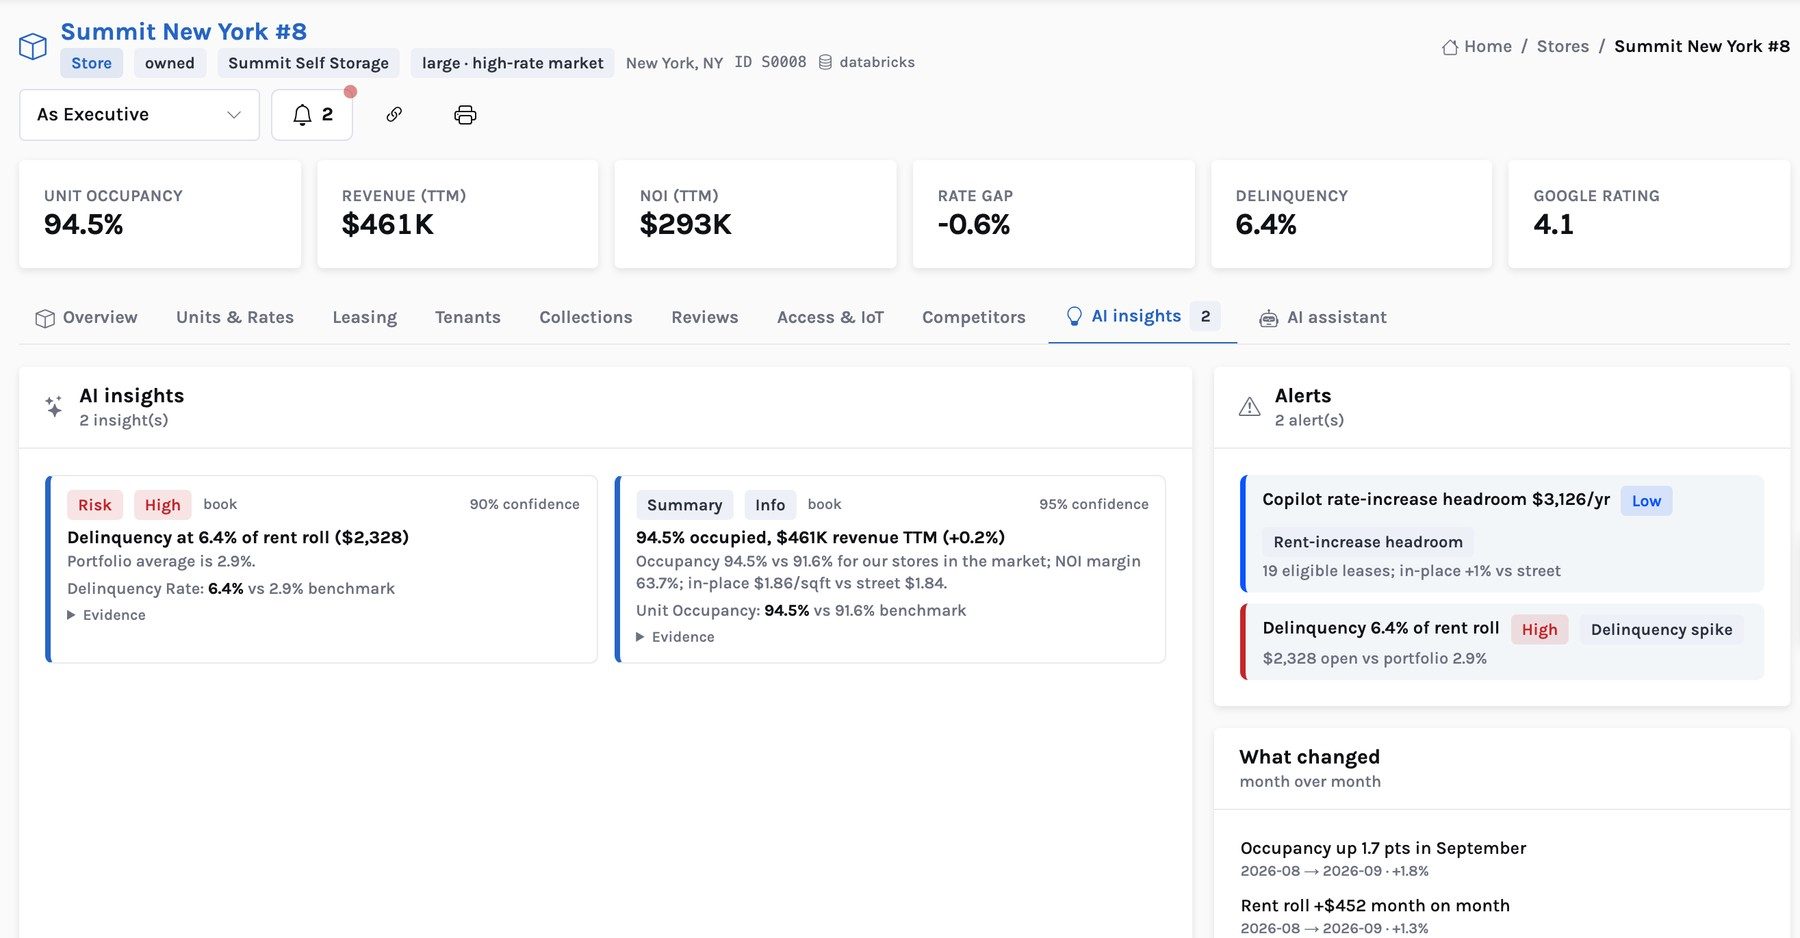
Behind the alerts: 251,241 insights and 12,480 recommendations, rebuilt every night. Demo portfolio, September 2026.
Every object an operator manages gets one page: KPIs, history, related entities, AI insights and an assistant that answers questions in that context.
Occupancy, revenue, NOI, rate gap, delinquency, reviews, access, competitors
Leases, rate history, payments, move-out risk, win-back
Type, size, climate, vacancy age, street vs in-place rate
Demand, supply per person, new supply, our share, price index
Managed stores, NOI, fee, contract dates, peer benchmark
Spend, move-ins, cost per move-in, discount given away
Stores in our markets, rate moves, public-company profile
Roll-up of stores per district manager, ranked by what needs attention
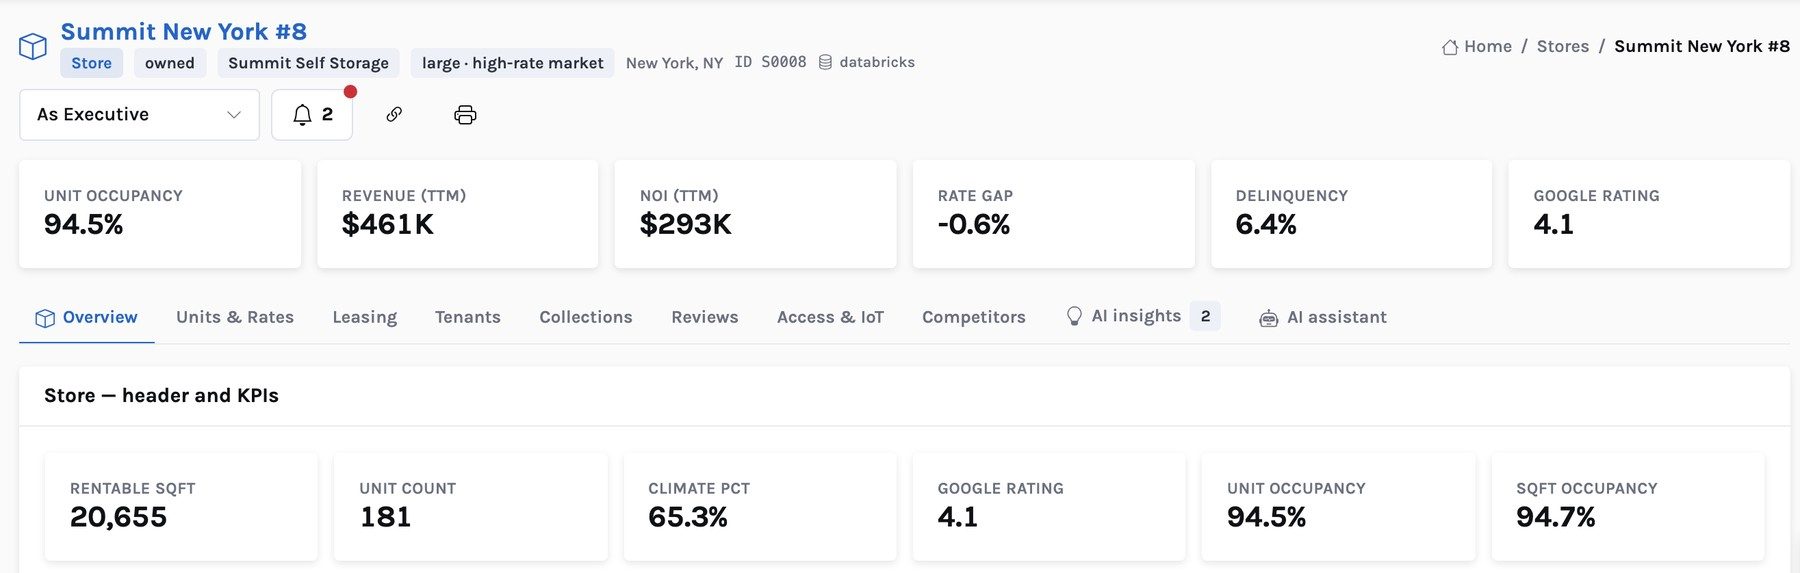
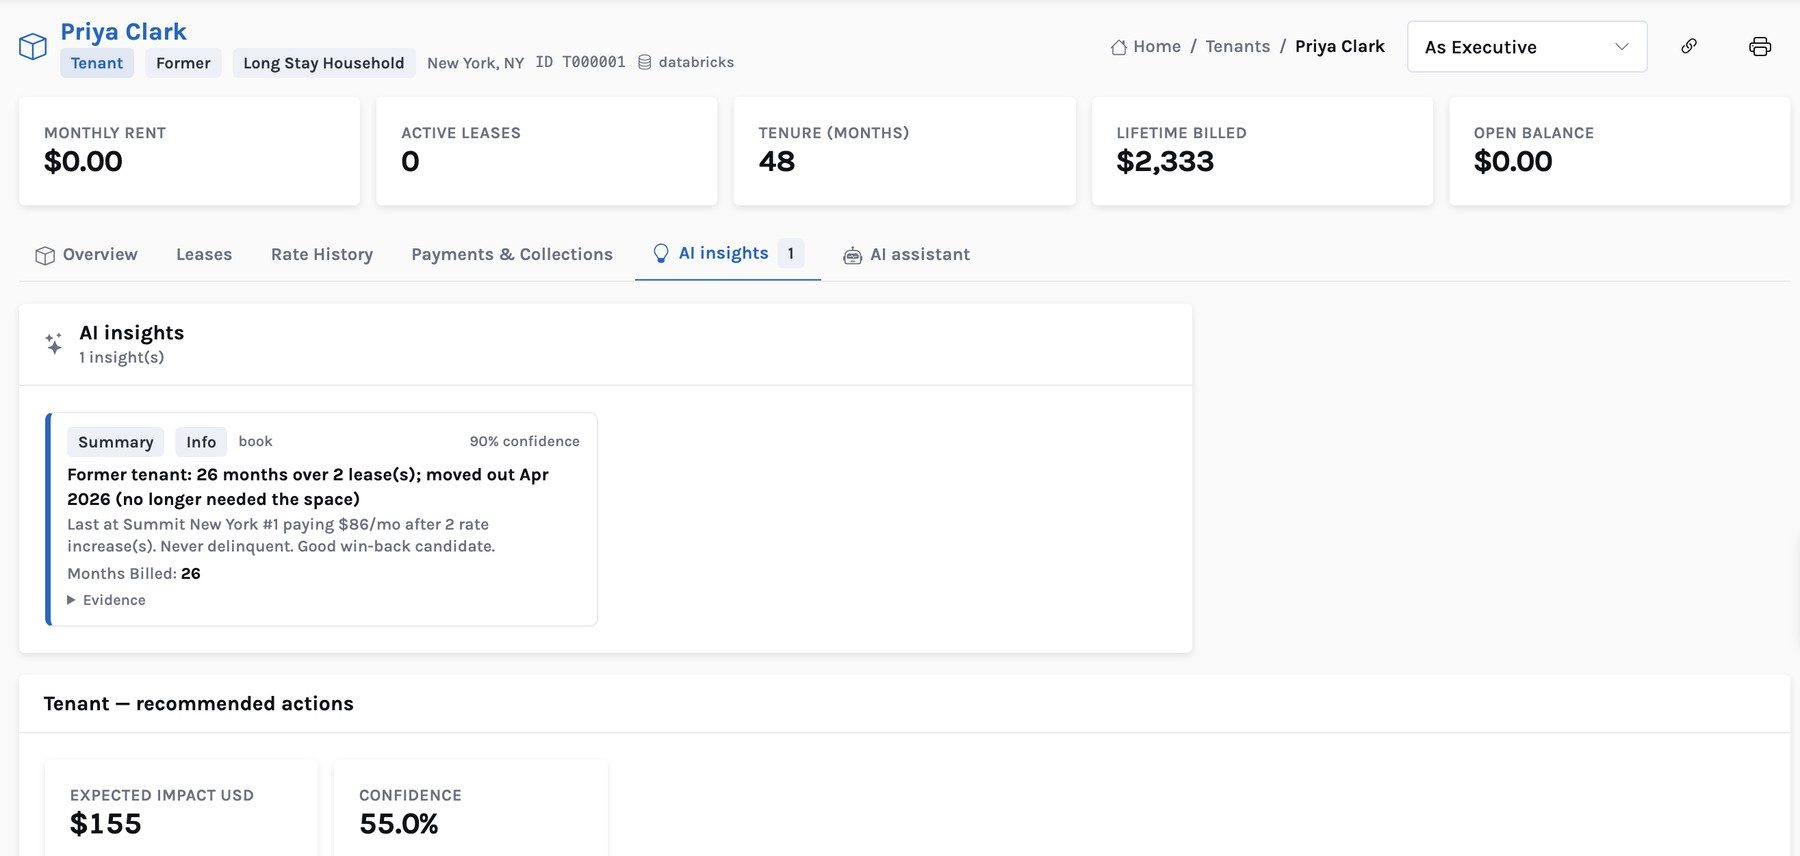
Each solution is a focused page: a ranked list, the reason behind every row, and the next step.
Tenant-level increase recommendations that weigh uplift against move-out risk, with fairness caps and the reasons. 4,807 eligible leases, $626K a year after expected move-outs.
Knows what each store can offer right now — vacant units by type, street rate and a size guide (“a one-bedroom apartment fits a 10x10”) — so a prospect gets a straight answer.
One brief per role — executive, revenue, district, marketing — with the KPIs and alerts that matter for that person, ranked by severity and value.
AI-written owner reports with peer benchmarks for third-party managed stores: 61 reports, and alerts for the 6 contracts ending within 12 months.
Site candidates scored on demand, population growth, supply per person, competitor rates and your footprint, with estimated NOI in year three.
Prioritised outreach: who to contact, why, through which channel, and the next step before lien. 996 open accounts, $327K owed.
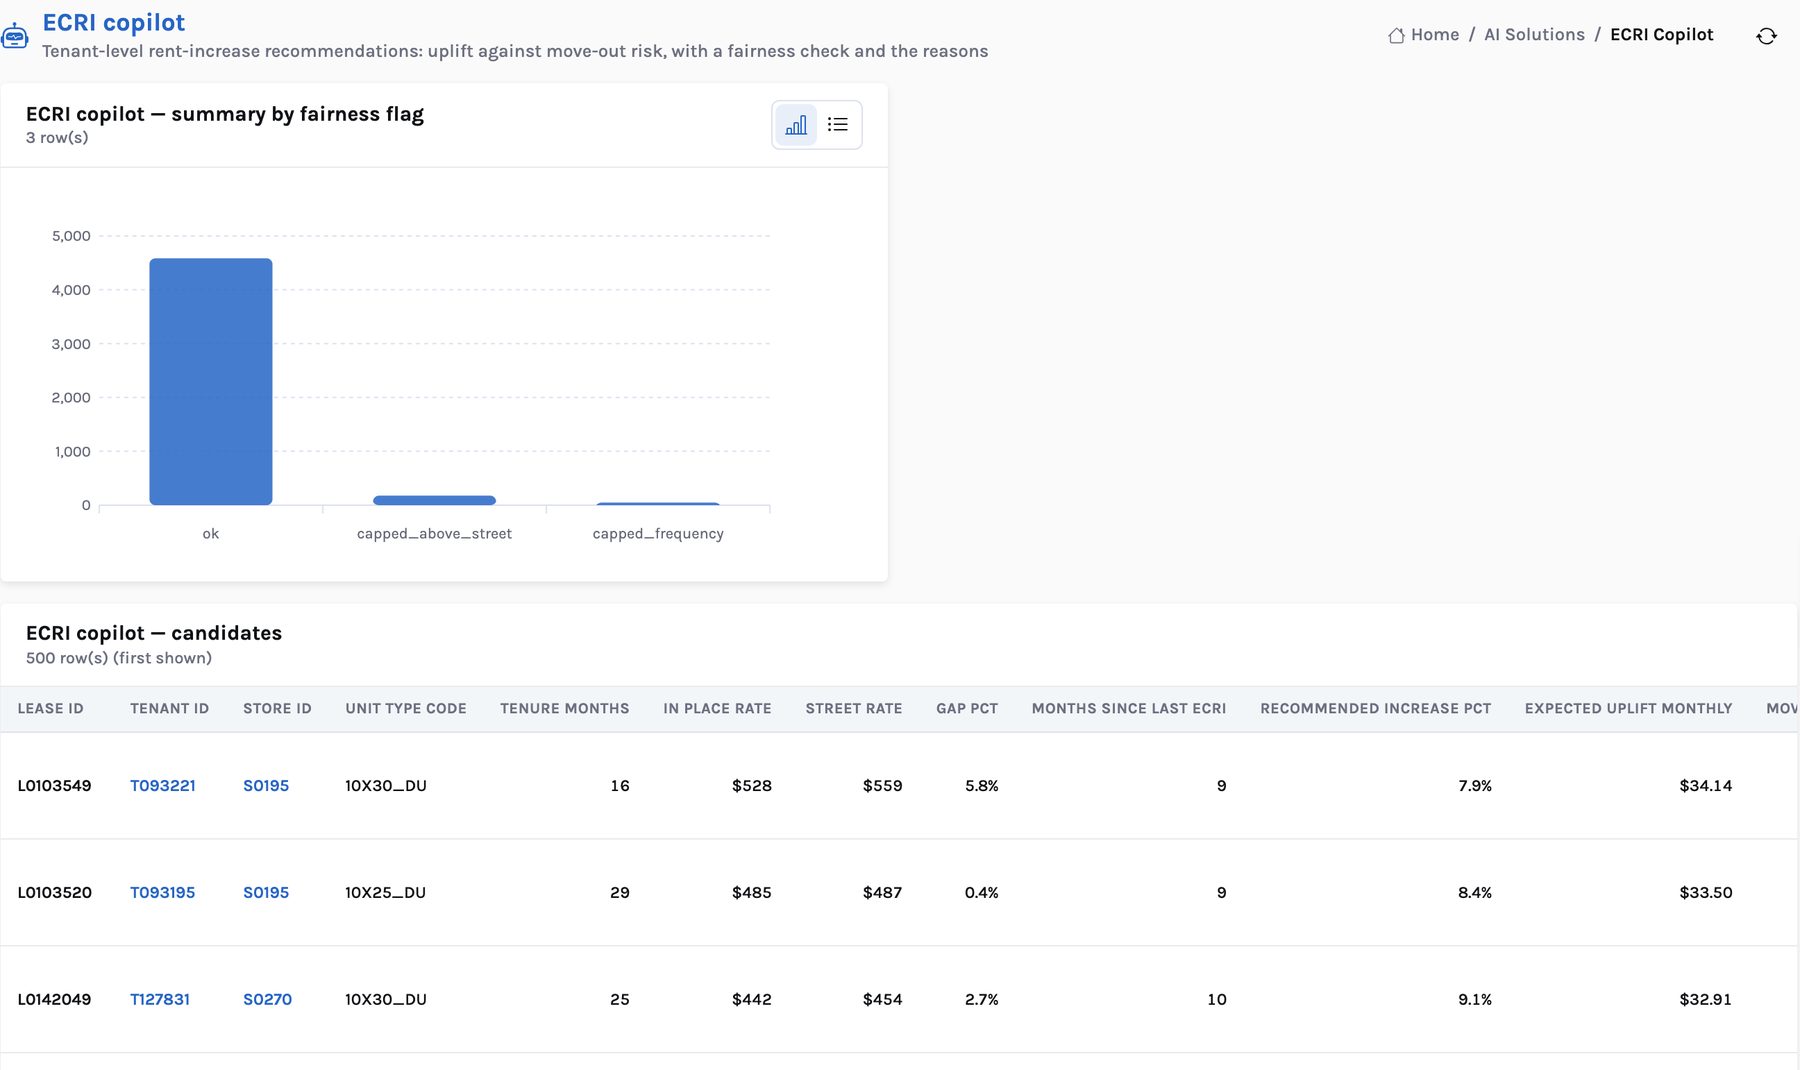
Candidates by fairness flag, with tenure, gap to street and expected uplift.
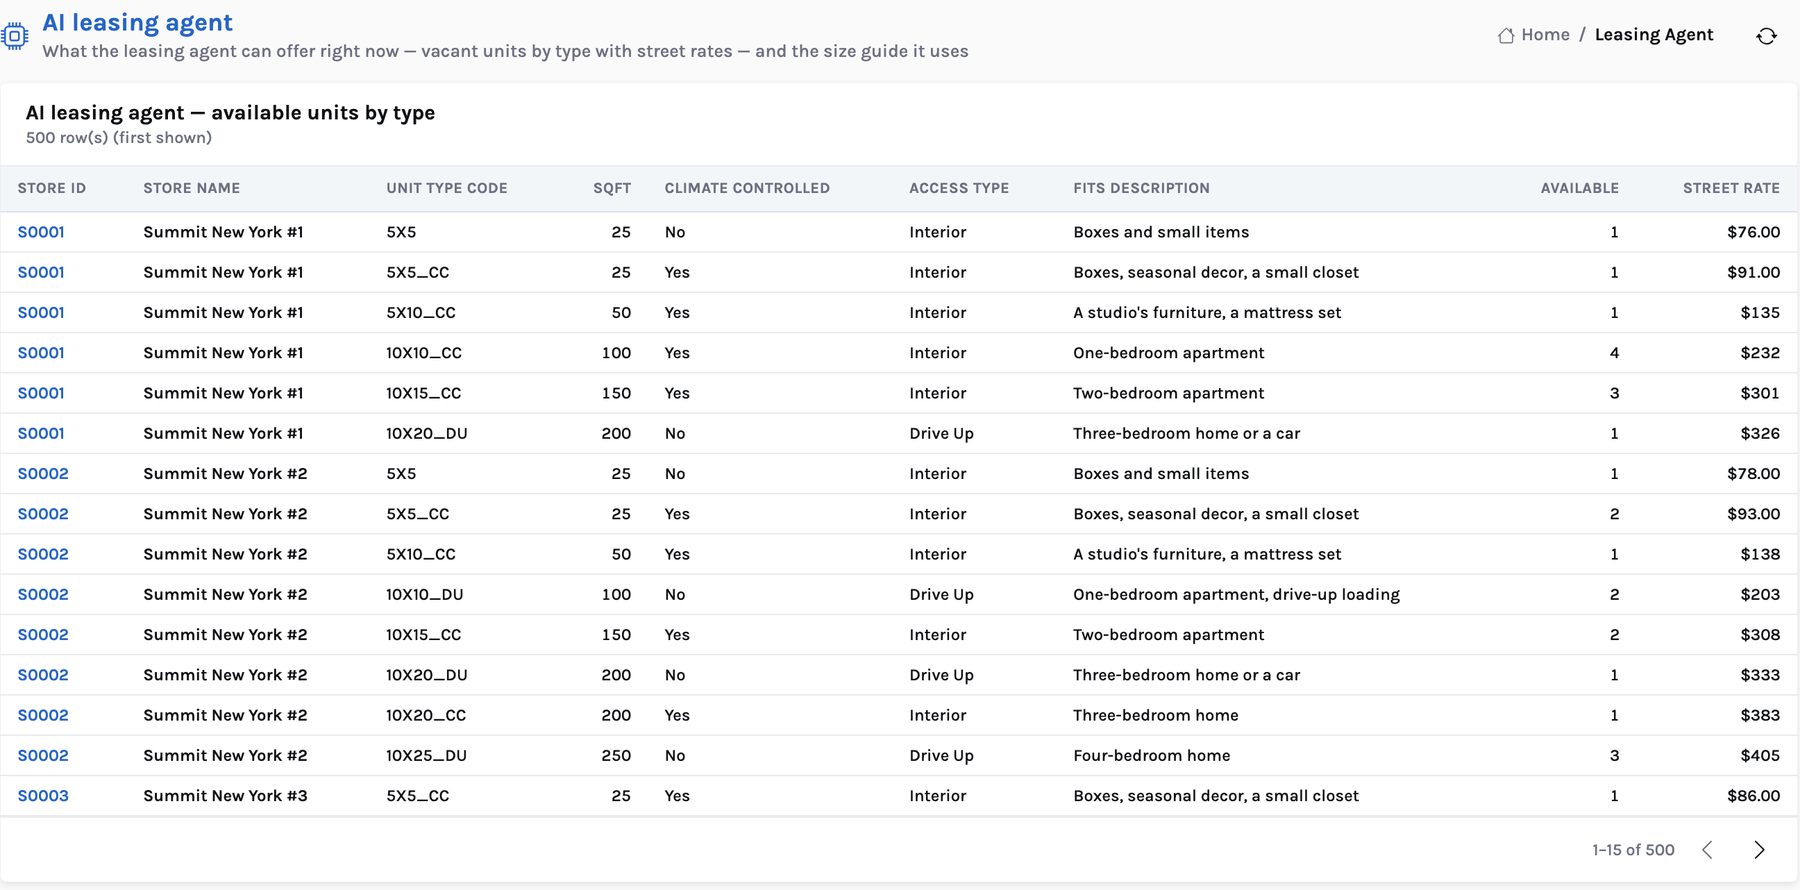
Available units by type, what fits in each, and today's street rate.
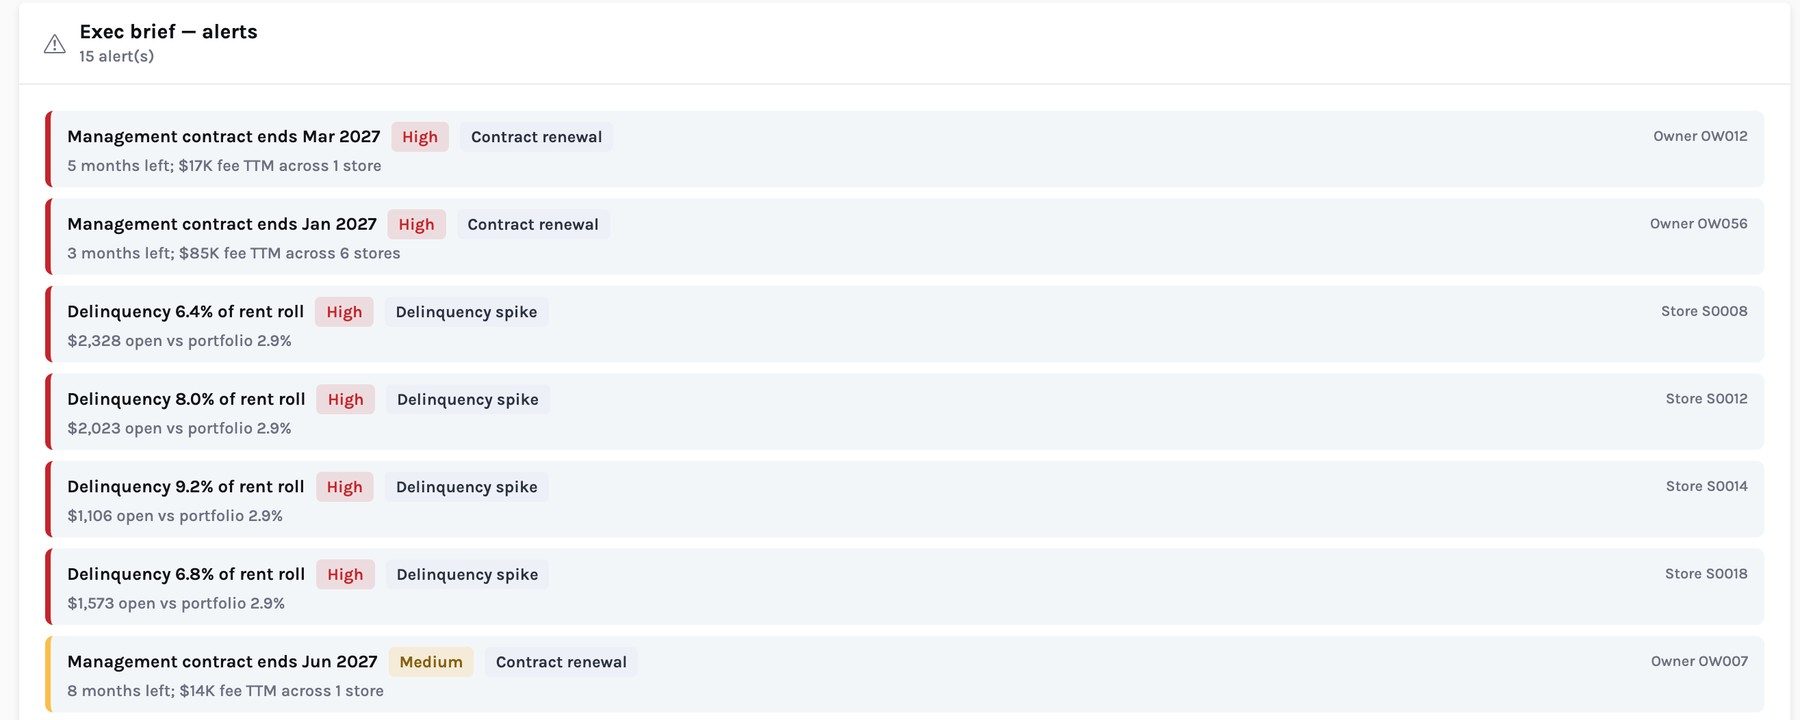
Contract renewals and delinquency spikes, ranked by severity.
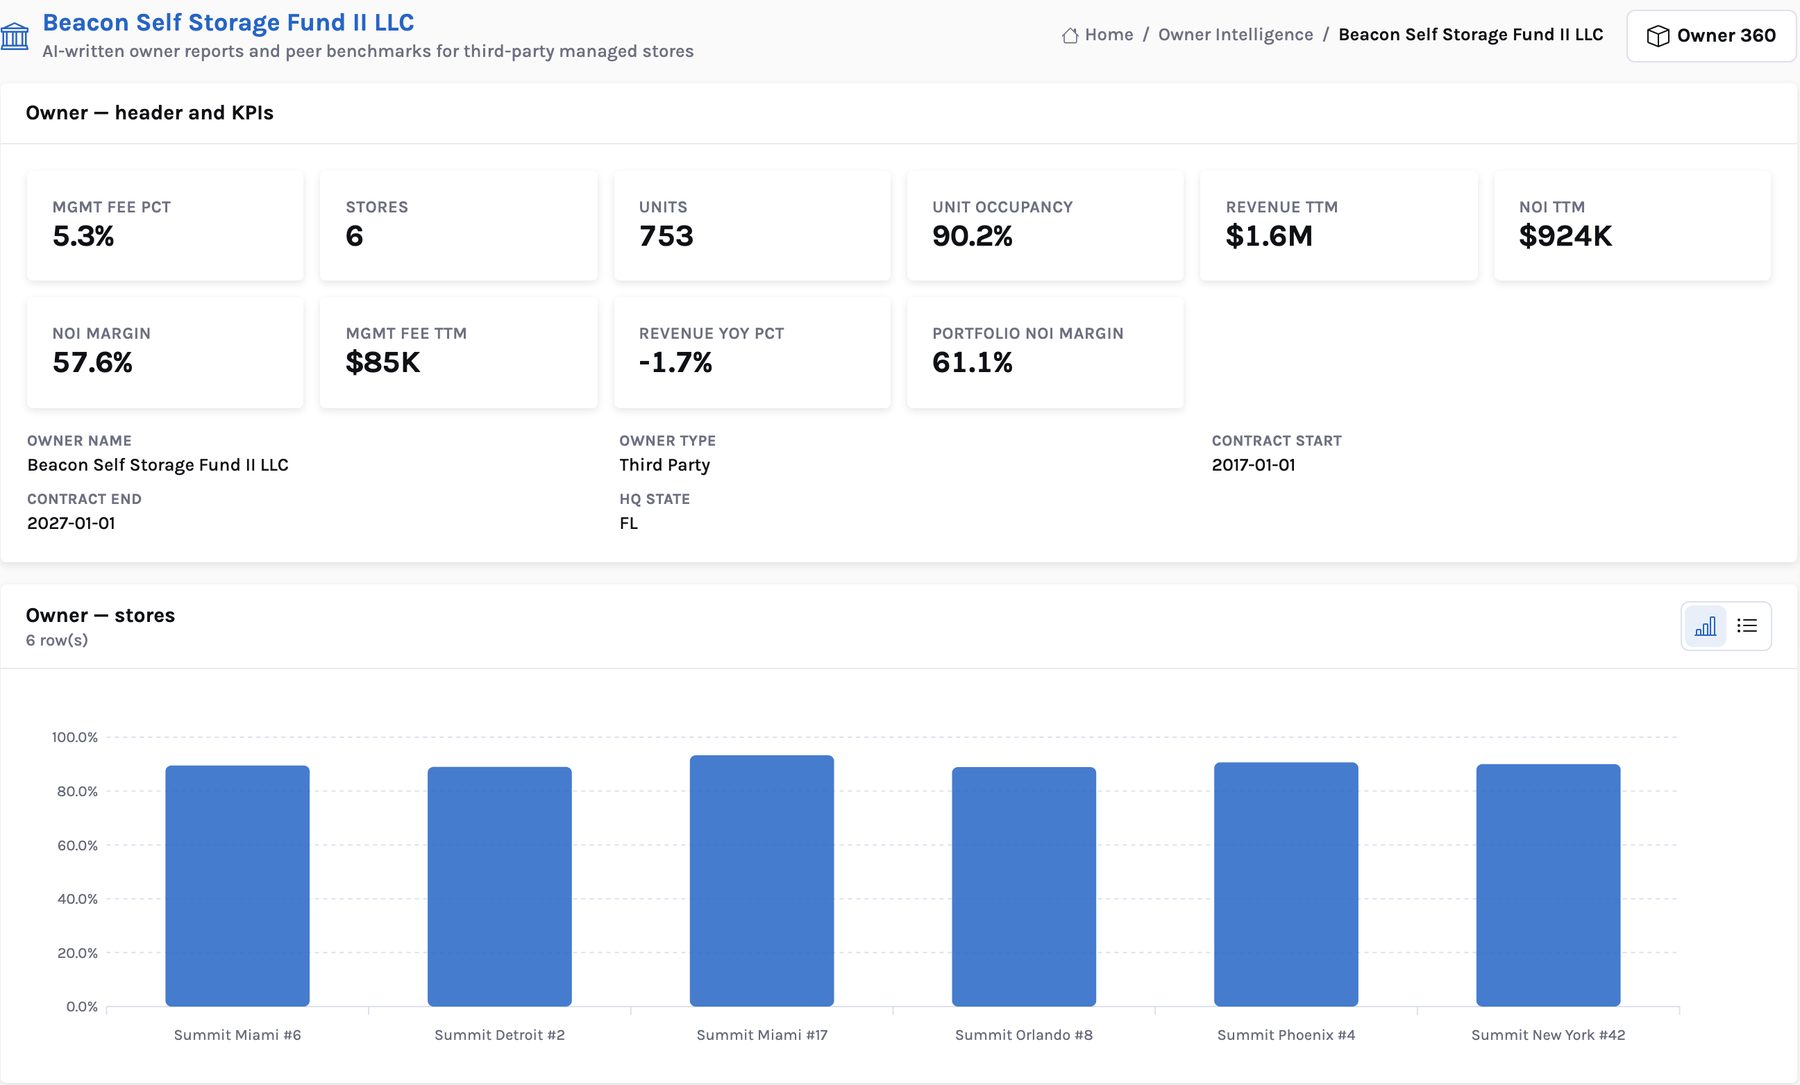
Fee, NOI margin against the portfolio, contract end date, store occupancy.
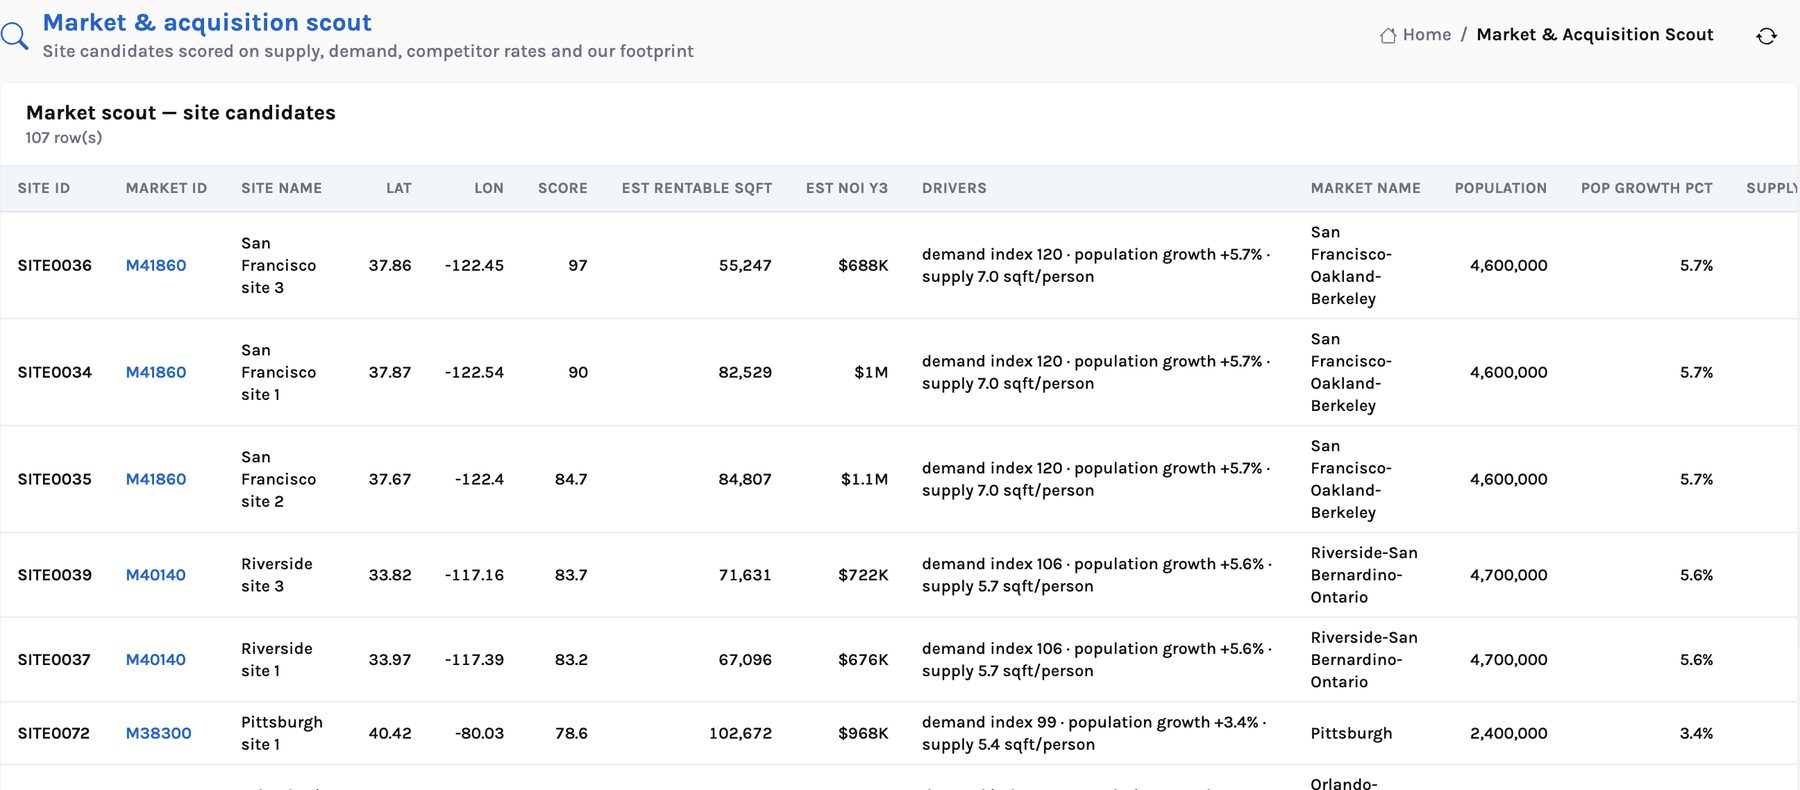
Scored site candidates with the drivers and year-three NOI.
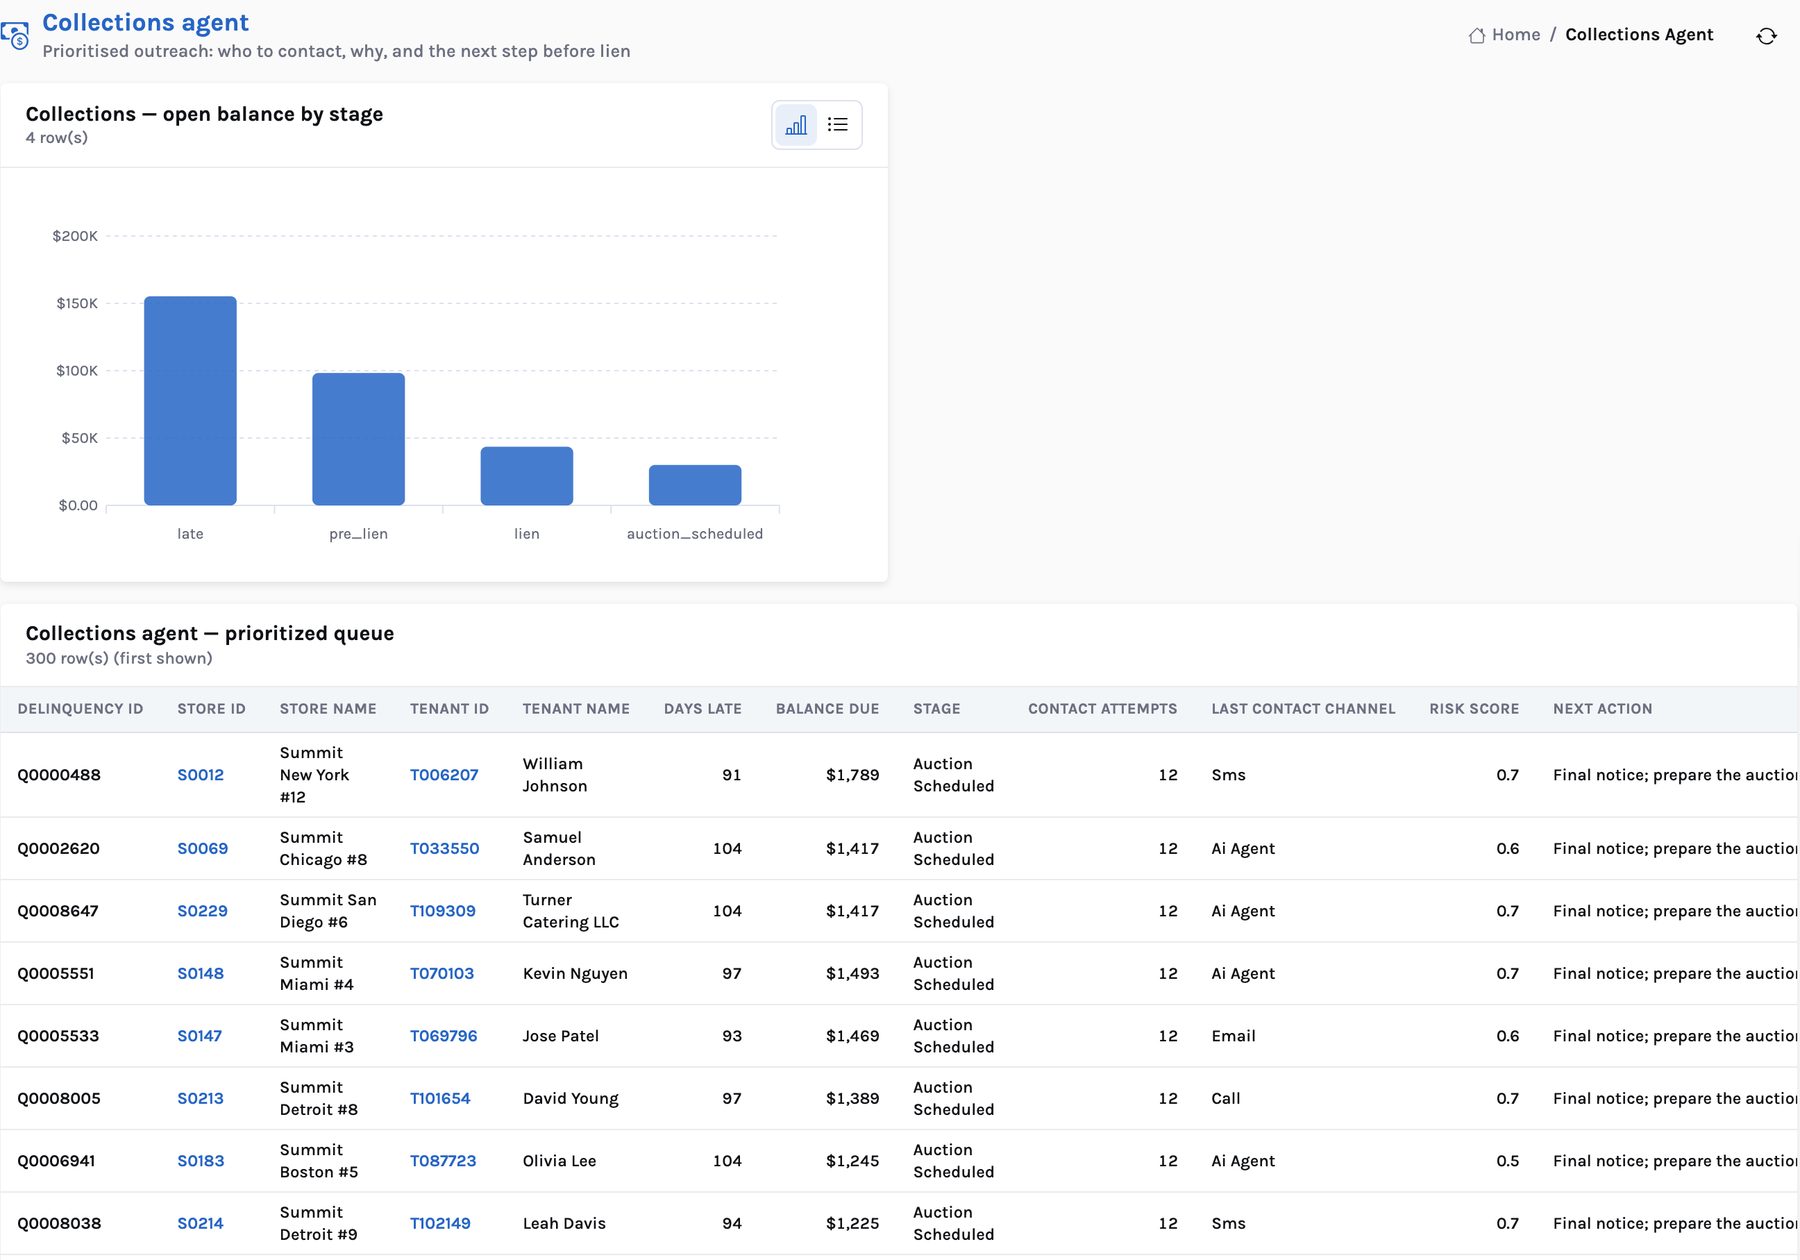
Open balance by stage and a prioritised queue with the next action.
Where revenue managers work: the AI's street-rate moves with reasons, and a like-for-like price index against every competitor in every market.
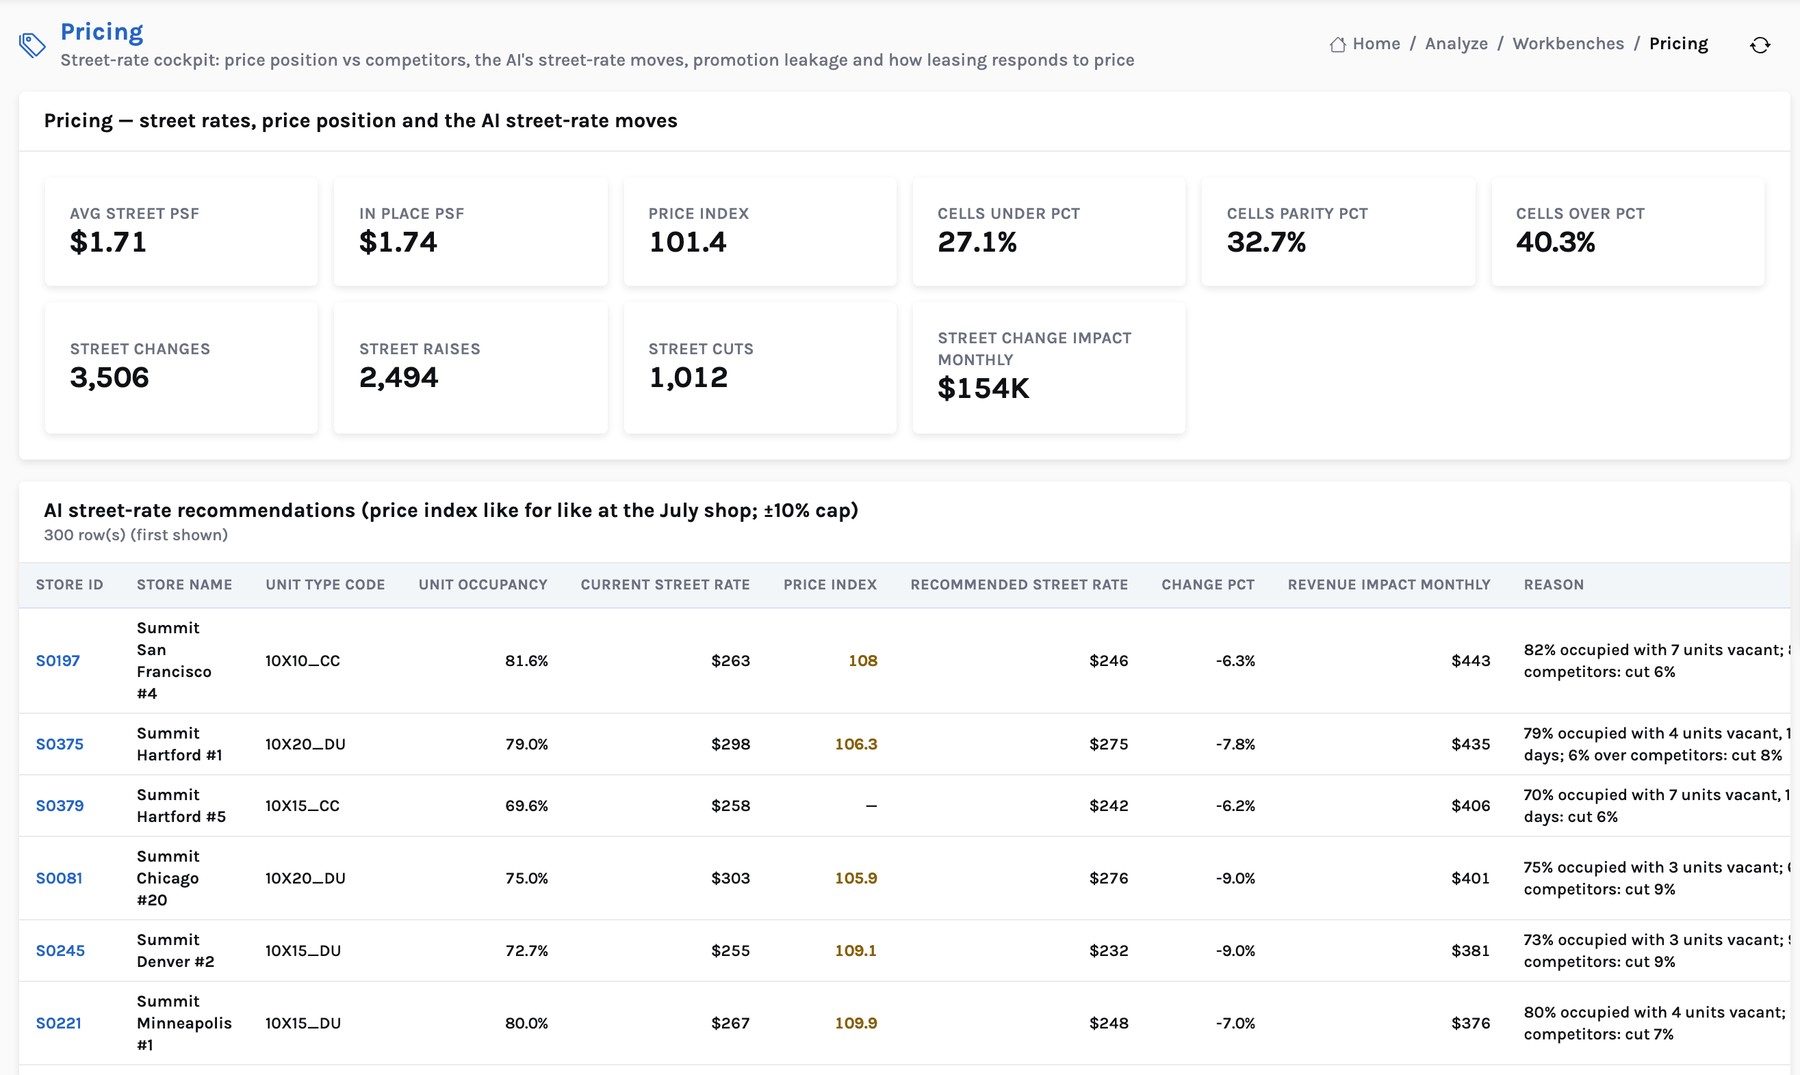
The street-rate AI works on 5,379 store × unit-type cells. It raises where occupancy is high, cuts deeper where units have sat empty 90+ days, and will not raise a cell already 8% over its competitors. No move exceeds ±10%.
100 = average competitor street rate for the same unit type in the same market. Demo competitor rates are illustrative.
The Competition workbench turns rate-shop data into answers: our index against each operator, the gap to the cheapest store in the market, our fair share of stores in the market, and an alert when a competitor moves a rate. 24 competitor rate-move alerts are open in the demo.
Operator 360 pages add the public-company profile from the InsightPulse company graph, so the company behind each competitor sits beside its street rates.
How the price index worksIllustrative example with generic competitor names and invented rates, drawn for this page. Vertical line = competitor average.
Set the maximum increase, the minimum tenure, the maximum gap to street and how long a vacated unit sits empty. See the uplift kept, the expected move-outs and the net — before a letter goes out.
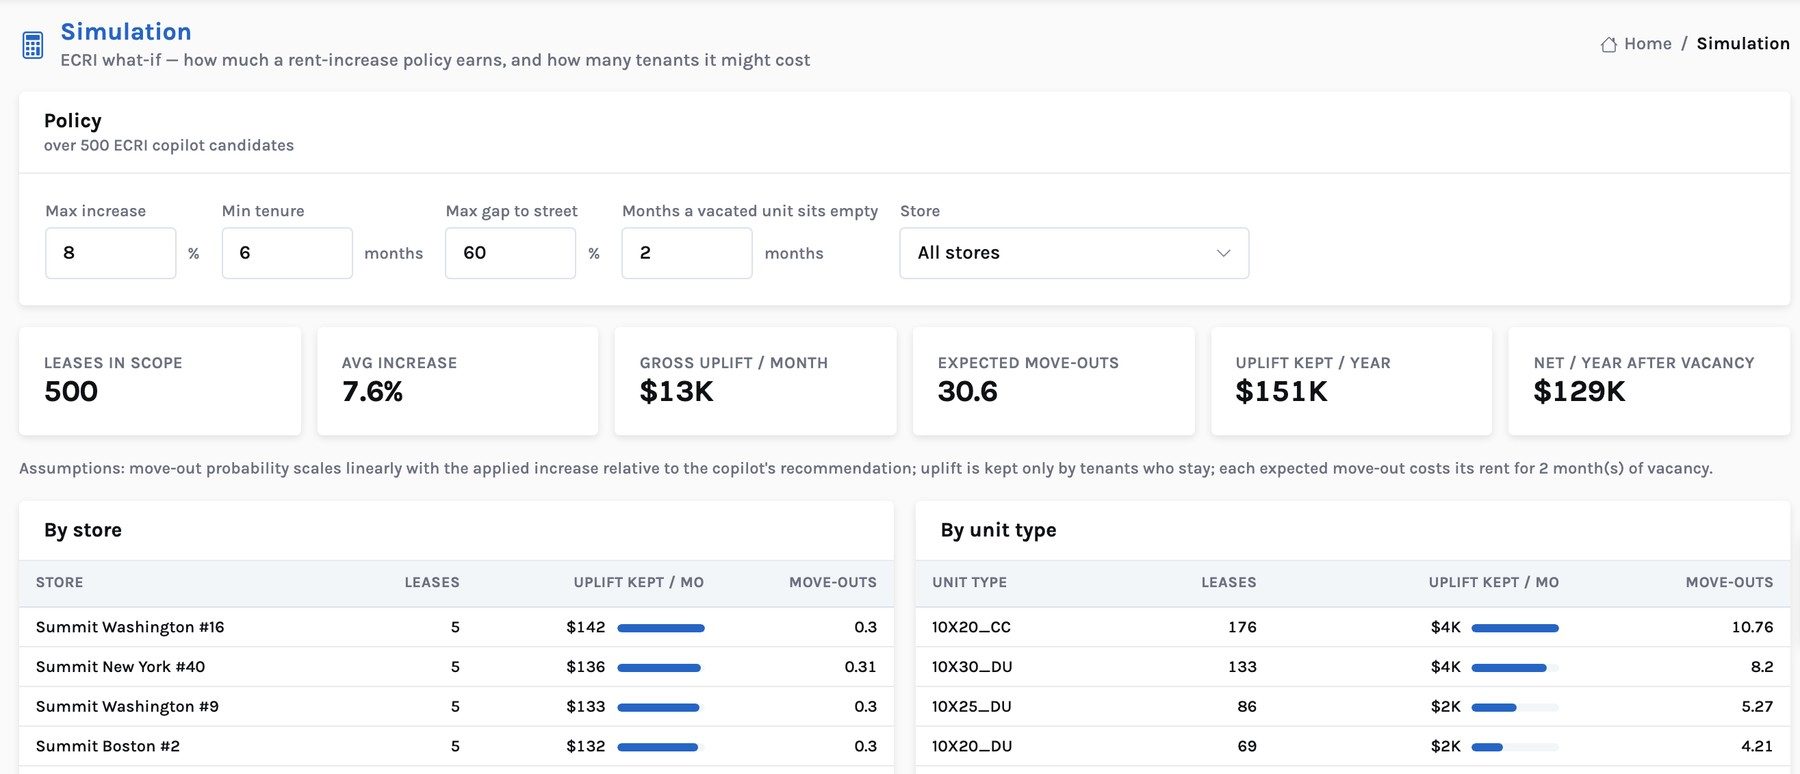
Assumes move-out probability scales with the applied increase relative to the copilot's recommendation, and uplift is kept only by tenants who stay.
One operator, four roles, the same numbers. How the briefs and 360s are used before lunch.
Data contracts refresh from the lakehouse, 268 automated data checks run, then insights, recommendations and alerts are rebuilt and cached. Pages answer in 0.05–3.3 seconds.
Two management contracts end within six months; four stores show delinquency above twice the portfolio rate. The COO opens the owner report for the $85K-fee relationship and books the renewal call.
She filters to cells where the AI recommends a cut over 6%, reads each reason — 79% occupied with 4 units vacant, 6% over competitors: cut 8% — and applies the ones she agrees with in the revenue engine.
She runs the simulator at an 8% and a 10% cap. She chooses the policy with the better net after expected move-outs and takes that list to the letter run in the PMS.
Summit New York #8 has delinquency at 6.4% of rent roll against 2.9% for the portfolio. The collections queue lists its past-due accounts with the next step for each, and the store manager works them before lunch.
The tenant 360 shows who is at risk and why. Two former tenants flagged as good win-back candidates get a call with a current unit and rate from the leasing agent.
Storage 360 is read-only. It recommends; your team applies rate changes and letters in your PMS and revenue-management engine.
Storage 360 reads governed tables through reviewed, read-only data contracts. The AI runs nightly. The app serves from a cache, so it is fast and cheap to run.
Storage 360 queries tables in your workspace under your permissions. There is no extract to a vendor cloud and nothing to reconcile.
Every source the app reads is a named, reviewed, read-only view with checks. Your data team sees exactly which columns are used, and why.
Heavy work runs once a night. Users read cached results, so page speed and warehouse cost do not depend on how many people log in.
It does not replace your systems of record. It sits across them and turns their output into explained decisions.
| Tool you have | What it does well | What Storage 360 adds |
|---|---|---|
| Property management system | System of record for units, leases, payments and move-ins | Reads it nightly; links tenant, unit, store and market into one 360 |
| Revenue-management engine | Sets and pushes street rates | A second, explained view of every move, with occupancy, vacancy age and competitor gap; flags cells to review |
| Rate-shop feed | Collects competitor street rates | Like-for-like price index per cell, gap to the cheapest store, rate-move alerts |
| BI dashboards | Show what happened, for analysts | Say what to do next, for every role, in plain sentences with evidence |
| Spreadsheets & owner decks | Flexible, familiar | AI-written owner reports and simulations that update every night |
Start with your own stores and your own data. Finish with a measured answer to one question: is the upside real for us?
The full story for CIOs and revenue leaders: the AI layer, the pricing and rent-increase logic, the architecture and the pilot plan.
A 45-minute walkthrough of the demo portfolio, then a pilot plan for your lakehouse.
Self-storage REITs • Regional operators • Third-party managers • Owner-investors