- contact@verticalserve.com

AI-native growth, staffing and quality intelligence for home health, hospice, personal care and private-duty nursing. Every patient, caregiver, branch and county gets a 360 view, benchmarked against the CMS-certified agencies around it. Every morning the AI says which referral you are about to lose, which visit has no caregiver, and what to do about it.
Figures from Northwind Home Care, a fictional operator in the Home Care 360 demo build (synthetic patients and caregivers, snapshot 30 September 2026). Competitors are public CMS Care Compare data. Not a customer result.
Hospitals and physicians keep referring. Agencies turn the referral away because no nurse or aide is free to start care, then lose the caregivers they have to burnout and long drives. Meanwhile CMS publishes every competitor's star rating, payers deny claims that could have been fixed before they dropped, and hospice stays drift past six months. The data for all of it sits in five systems. Home Care 360 joins it on your lakehouse and turns it into ranked, explained actions.
Intake declines the referral because no RN or aide can start care this week. Nobody counts what that cost, or which hire would have prevented it.
Aides turn over fastest. The warning signs — call-outs rising, hours cut, long drives, pay below the branch median — are in the schedule and payroll, but nobody reads them in time.
Referral sources and families compare agencies on CMS Care Compare. Few agencies know, county by county, which measures put them behind.
Eligibility, coding, face-to-face and EVV denials are mostly preventable — if someone checks before submission. Authorizations expire or run out while visits continue.
Half of patients stay a few weeks; a long tail stays past 180 days, where recertification, cap exposure and live discharges concentrate.
EHR, scheduling and EVV, HR, claims and public CMS files each answer one question. None tells a branch director at 7 a.m. which three things to fix today.
What the AI layer found in the 150-branch demo agency. The largest single leak is growth turned away for want of a caregiver.
3,044 referrals in twelve months, priced at the expected revenue for their service line and payer. The app turns them into 587 hires by branch and discipline, recapturing about $13.1M a year at a 60% recapture rate.
Every visit in the next 14 days without a caregiver gets up to five candidates, scored on drive time, continuity with the patient, weekly hours and overtime, and reliability. Look-ahead fill rate: 91.5%.
Every active caregiver scored for leaving in the next 90 days: 26 high and 527 medium risk, with the drivers and a specific action. Expected replacement cost in 90 days: $1.27M.
Quality star 3.26 vs 3.24 for the CMS agencies in the same counties, but patient-survey star 2.95 vs 3.23. The gap is specific: 54.6% of patients rate the agency 9 or 10, against 84.4% for county competitors.
Denial rate 9.3% and $11.0M open A/R. 494 pending claims are at high denial risk today, each with the likely reason and the fix; 543 authorizations expire within 14 days.
Average stay 73 days, median 25, live discharges 16.1%. Every active hospice patient is scored for a stay past 180 days and a live discharge, for review at the interdisciplinary group meeting.
All agency figures come from the Home Care 360 demo build: Northwind Home Care, a fictional operator with synthetic patients, caregivers, visits and claims, snapshot 30 September 2026, twelve months to September. Competitor figures are public CMS Care Compare data. Scores and dollar values are the demo build's estimates, not a customer result.
An insight is not a chart. It is a sentence a branch director can act on, with the benchmark, the evidence, the confidence, the action and the dollar value beside it.
Composite of the Branch 360 for one demo branch: the insight card, its alert, what changed and the recommended action, as the demo build wrote them. Names are synthetic.
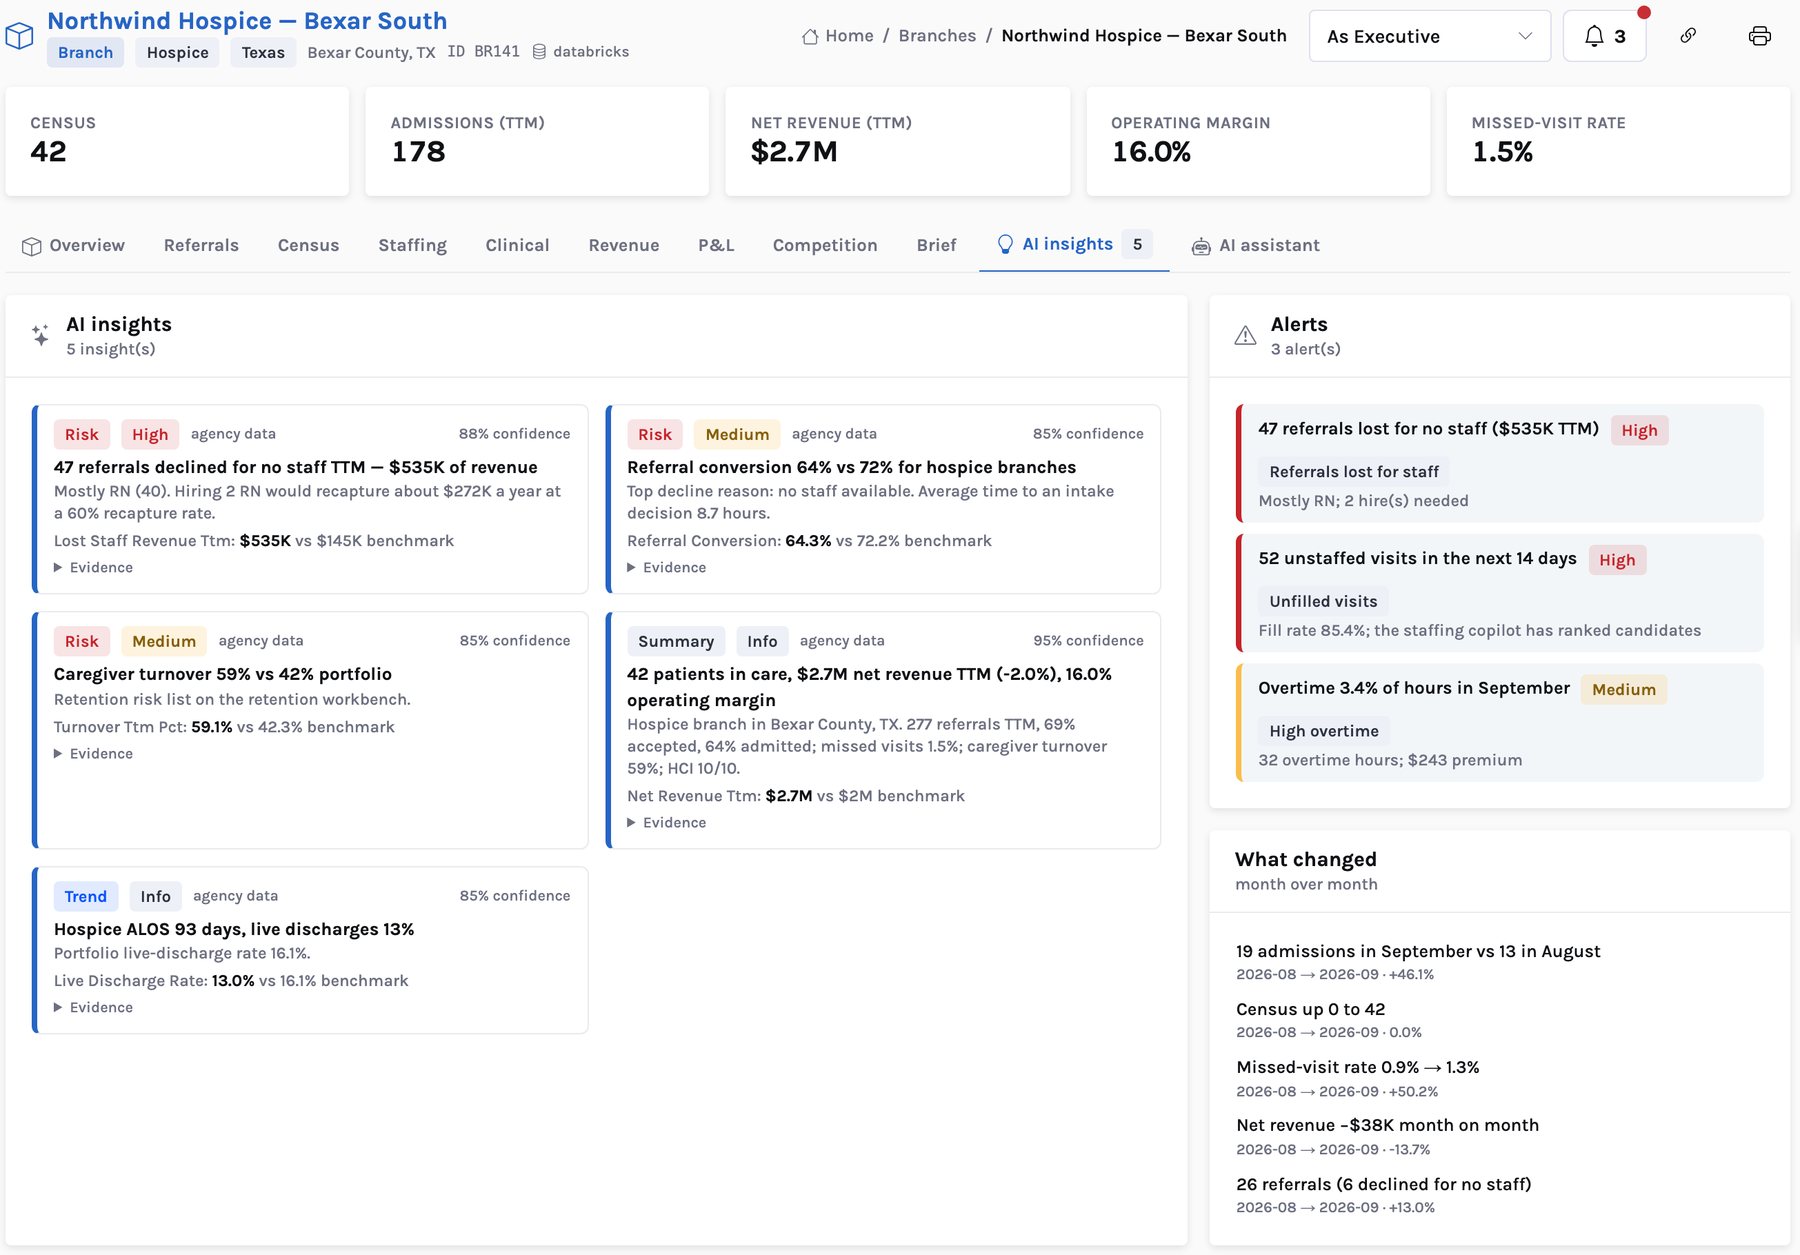
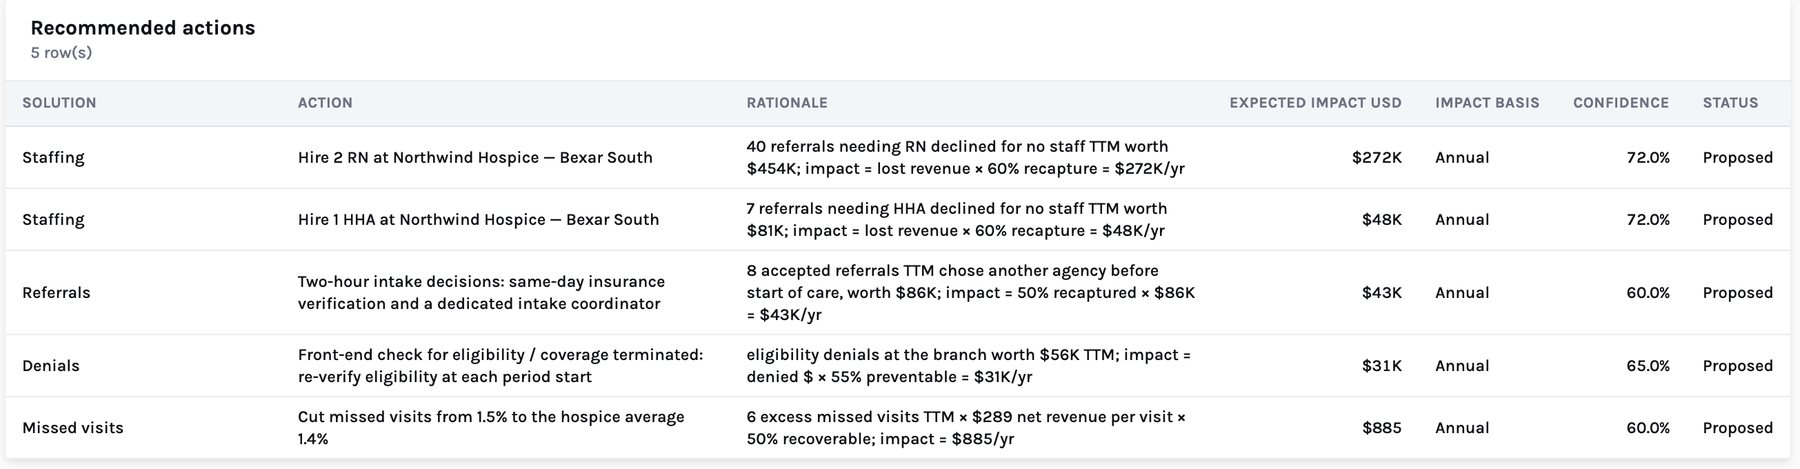
A lost referral, the caregiver who was not available and the CMS agencies in the same county are one click apart, because they live on one model with one definition per metric.
Blue = internal data, synthetic in the demo (patients carry birth year and county only — no date of birth, address or Medicare number). Green = public CMS Care Compare provider data and real county geography. Every entity's 360 shows the same AI frame: insights, alerts, what changed and recommended actions.
Five roles, five morning briefs written overnight from the lakehouse. Each opens with the one number that matters to that person today, then goes to the page where the work happens.
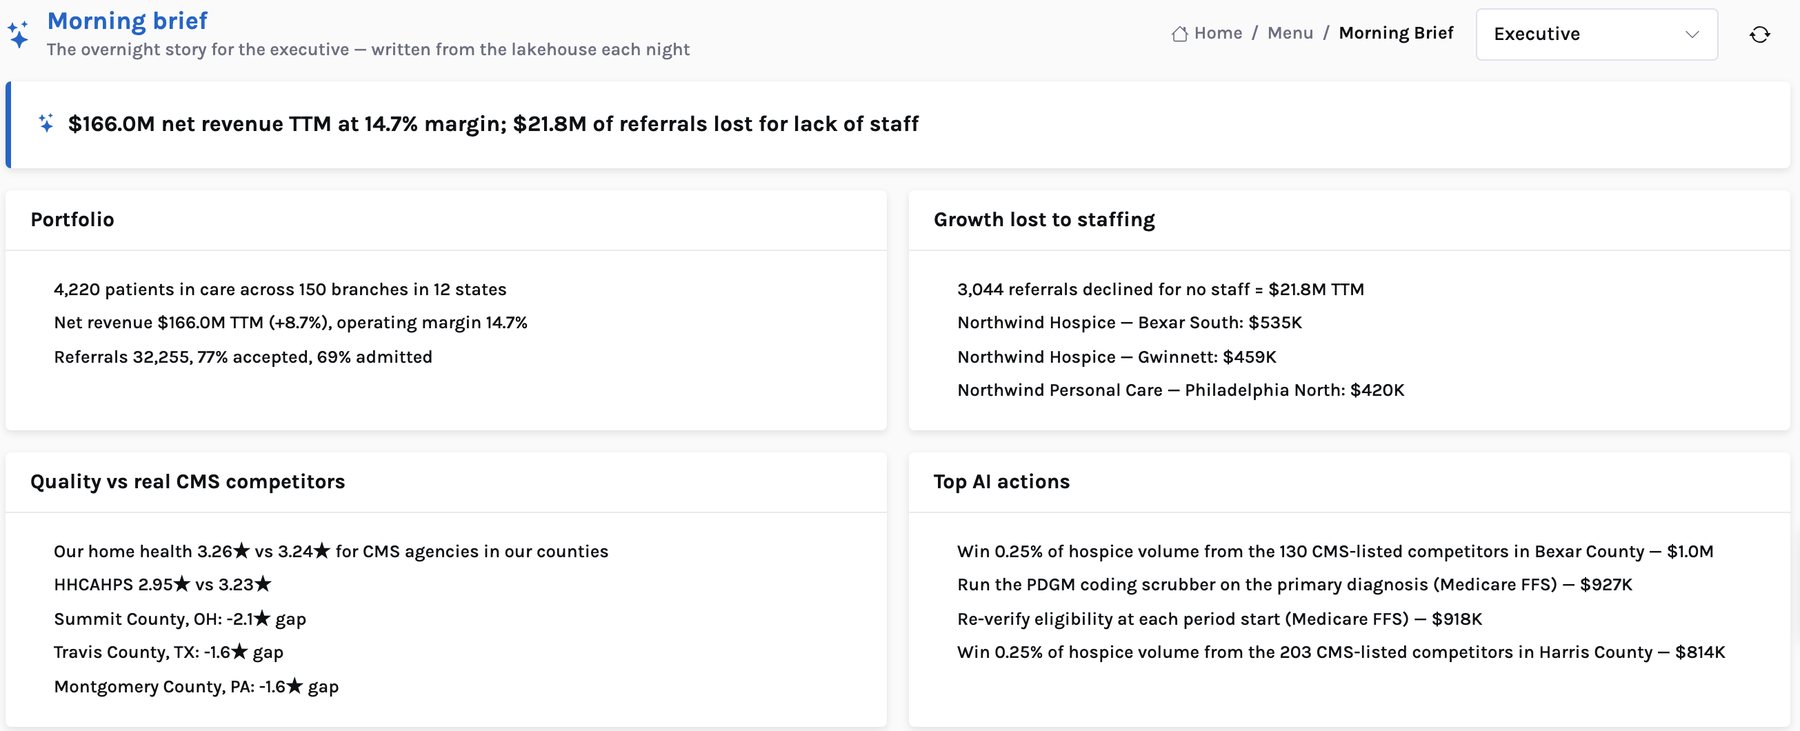
Each solution is a focused page: a ranked list, the reason behind every row, and the next step. Plus an assistant that answers questions from the governed data.
Referrals declined for no staff by branch and discipline, the revenue lost and the hires that would win it back. 3,044 referrals, $21.8M.
Up to five ranked caregivers for every open visit in the next 14 days, scored on drive time, continuity, hours, overtime and call-outs. 2,403 open visits.
Every scheduled visit in the look-ahead scored for a miss, with drivers; backups lined up for the riskiest. 25,765 visits scored, 238 high.
90-day leaving risk for every active caregiver with the drivers and a stay-interview action. 26 high, 527 medium.
30-day risk for every home-health patient, with drivers and a front-loaded visit plan. 288 high among 1,739 patients.
Units remaining, burn rate and projected exhaust for every active authorization: 543 expiring within 14 days, 423 over-used, 496 under-used.
Pending claims scored before submission with the likely reason and the fix. 494 at high risk, $1.2M expected.
Open home-health periods projected below their PDGM visit threshold, with the visits to schedule before the period ends. 176 high, $141K.
Every hospice patient scored for a stay past 180 days and a live discharge, for the IDG. 432 of 987 flagged high.
Each home-health branch against the average and best CMS agency in its county, measure by measure, widest gap first.
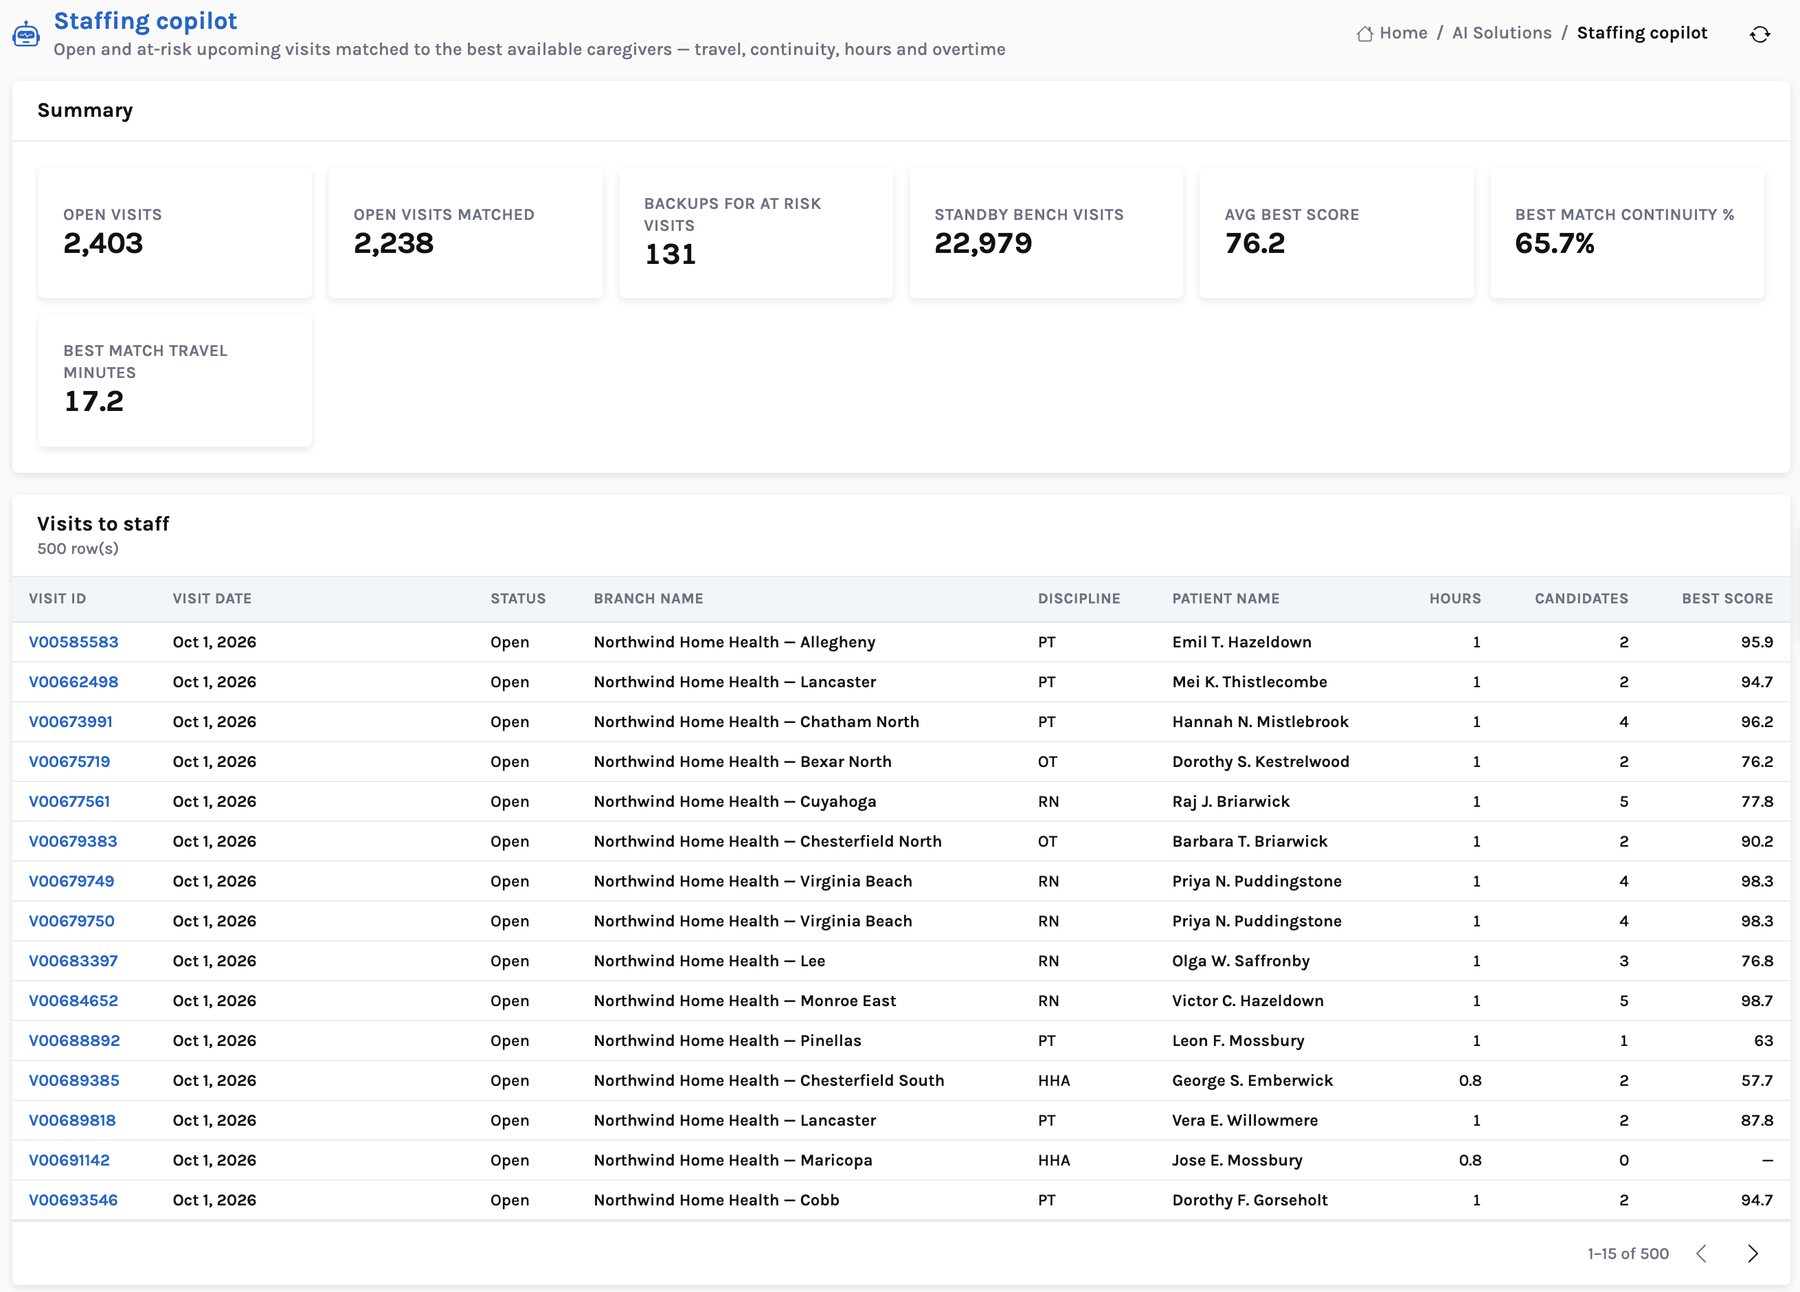
The scheduler starts the day with candidates, not a blank grid: best match on average 17.2 minutes away, and two in three best matches have seen the patient before.
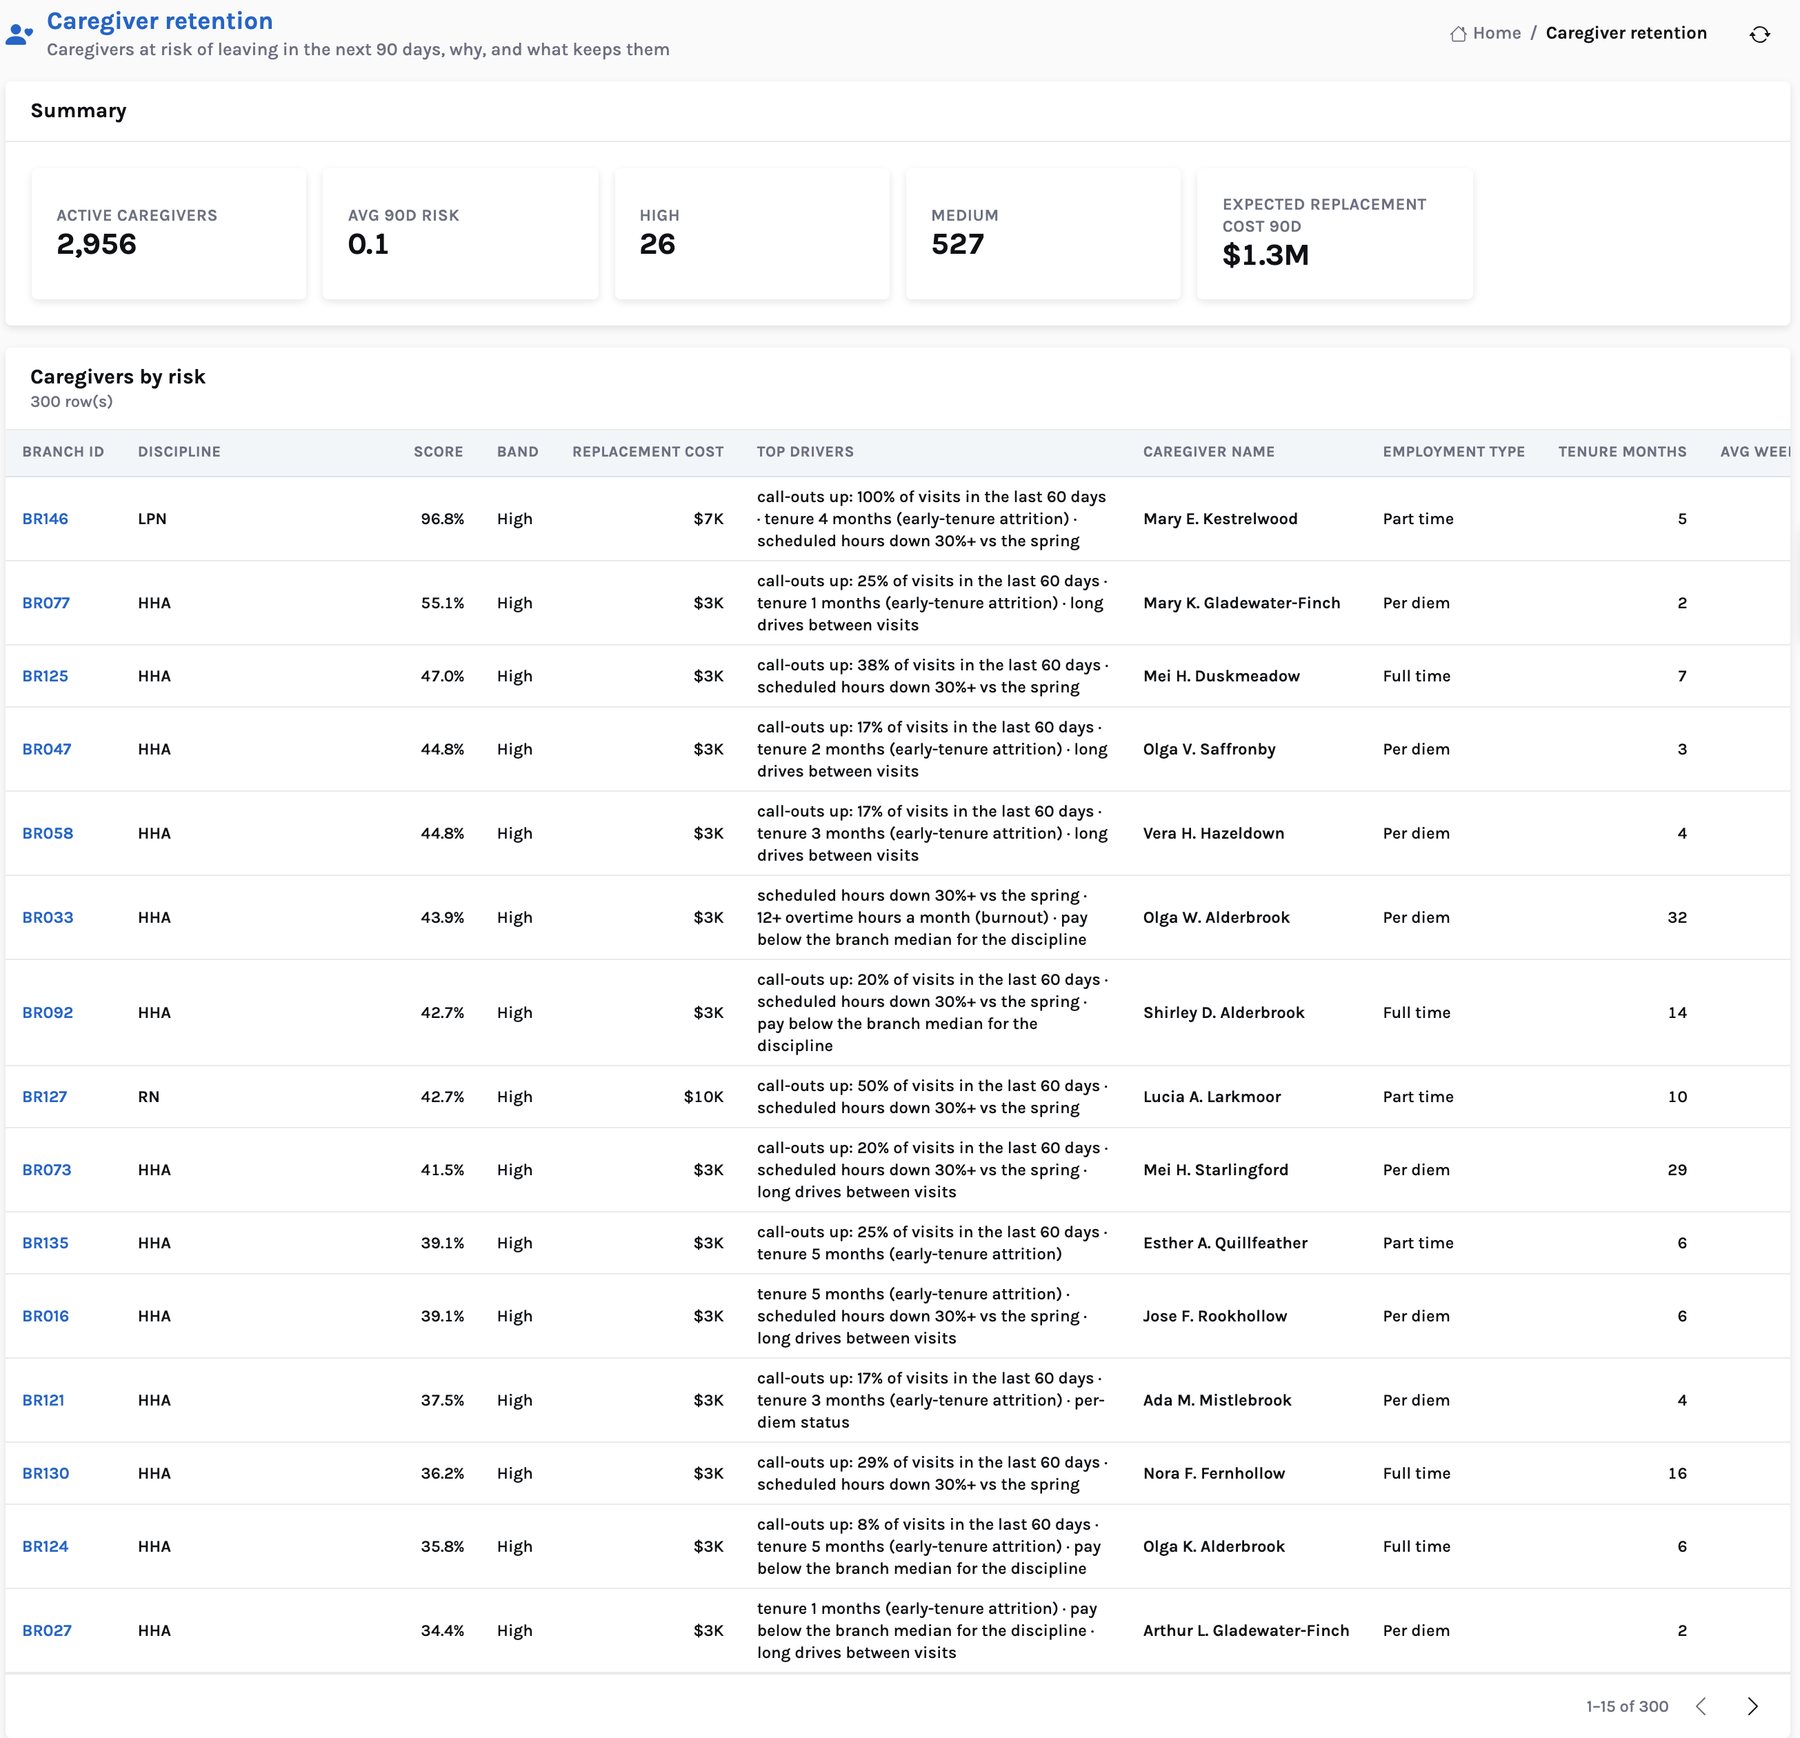
Each score lists its drivers in plain words — call-outs up, early tenure, hours cut, long drives — so the coordinator knows what to fix in the stay interview.
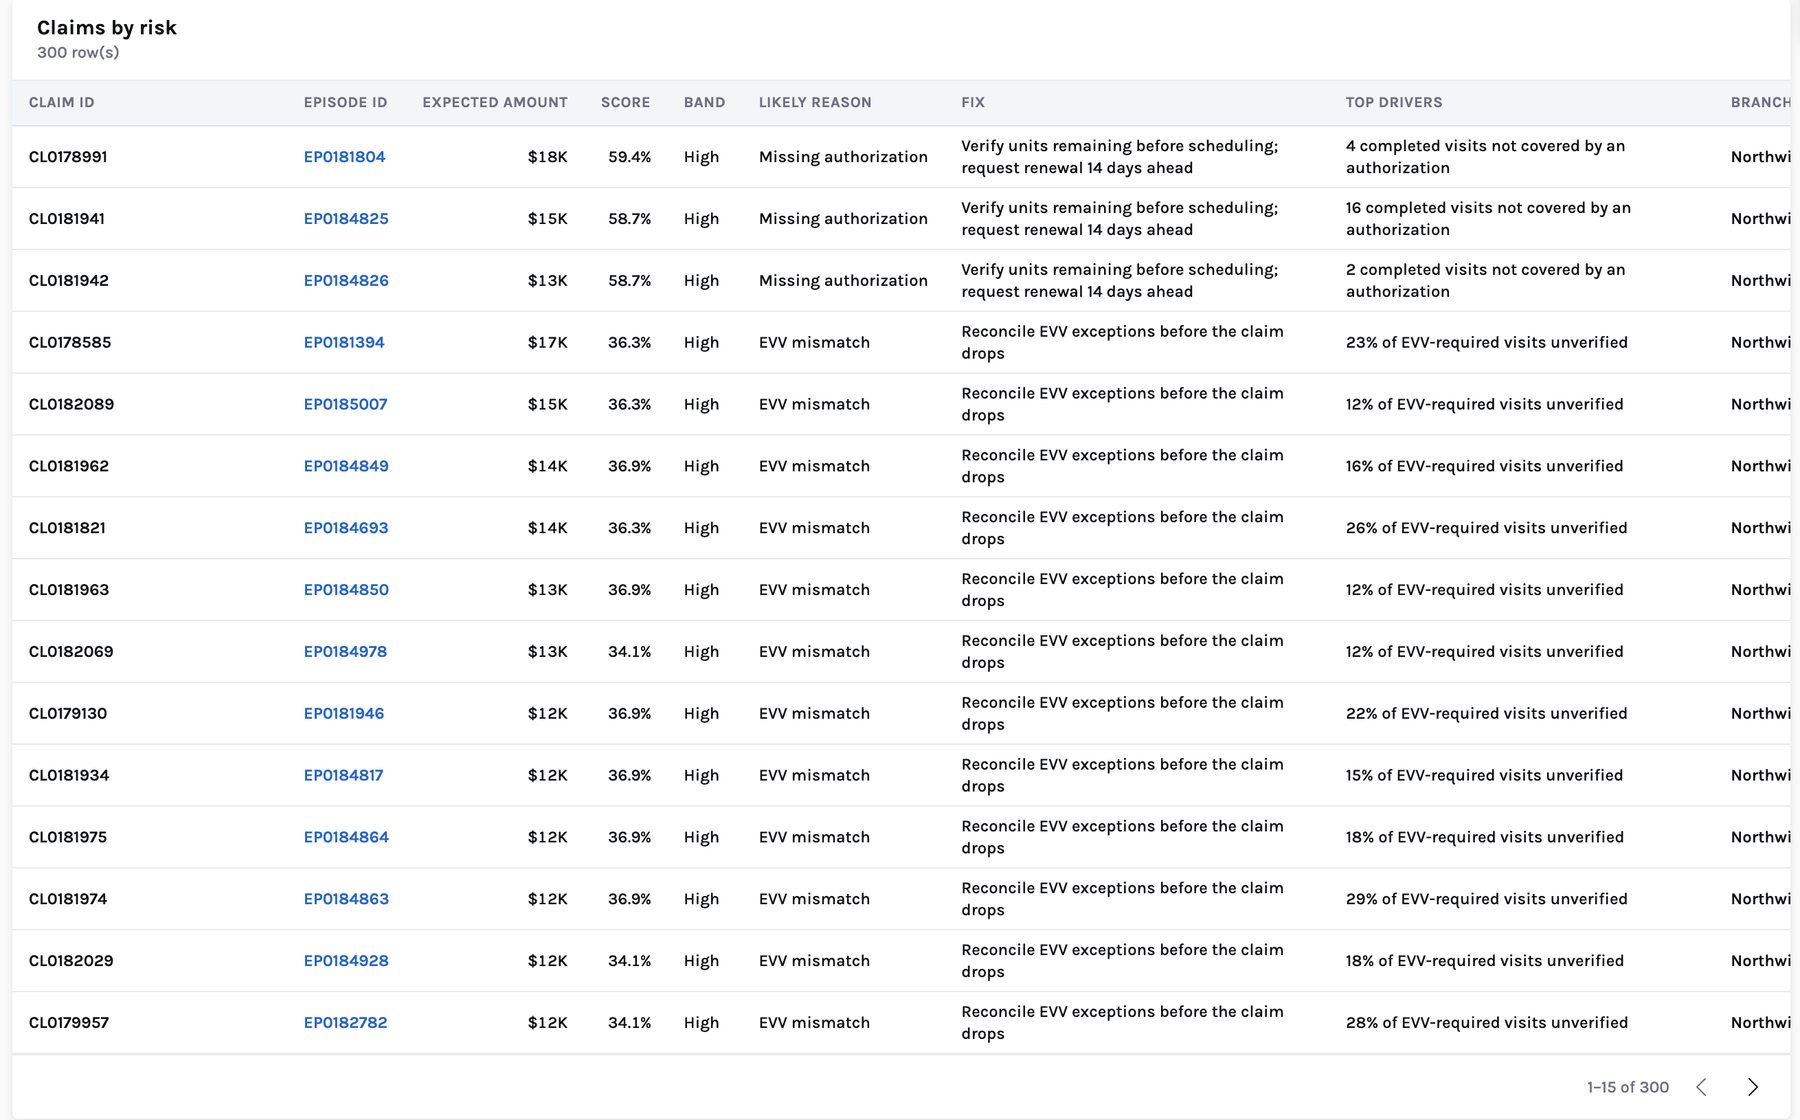
Each pending claim shows the likely denial reason and the fix — reconcile EVV exceptions, renew the authorization, attach the face-to-face note.
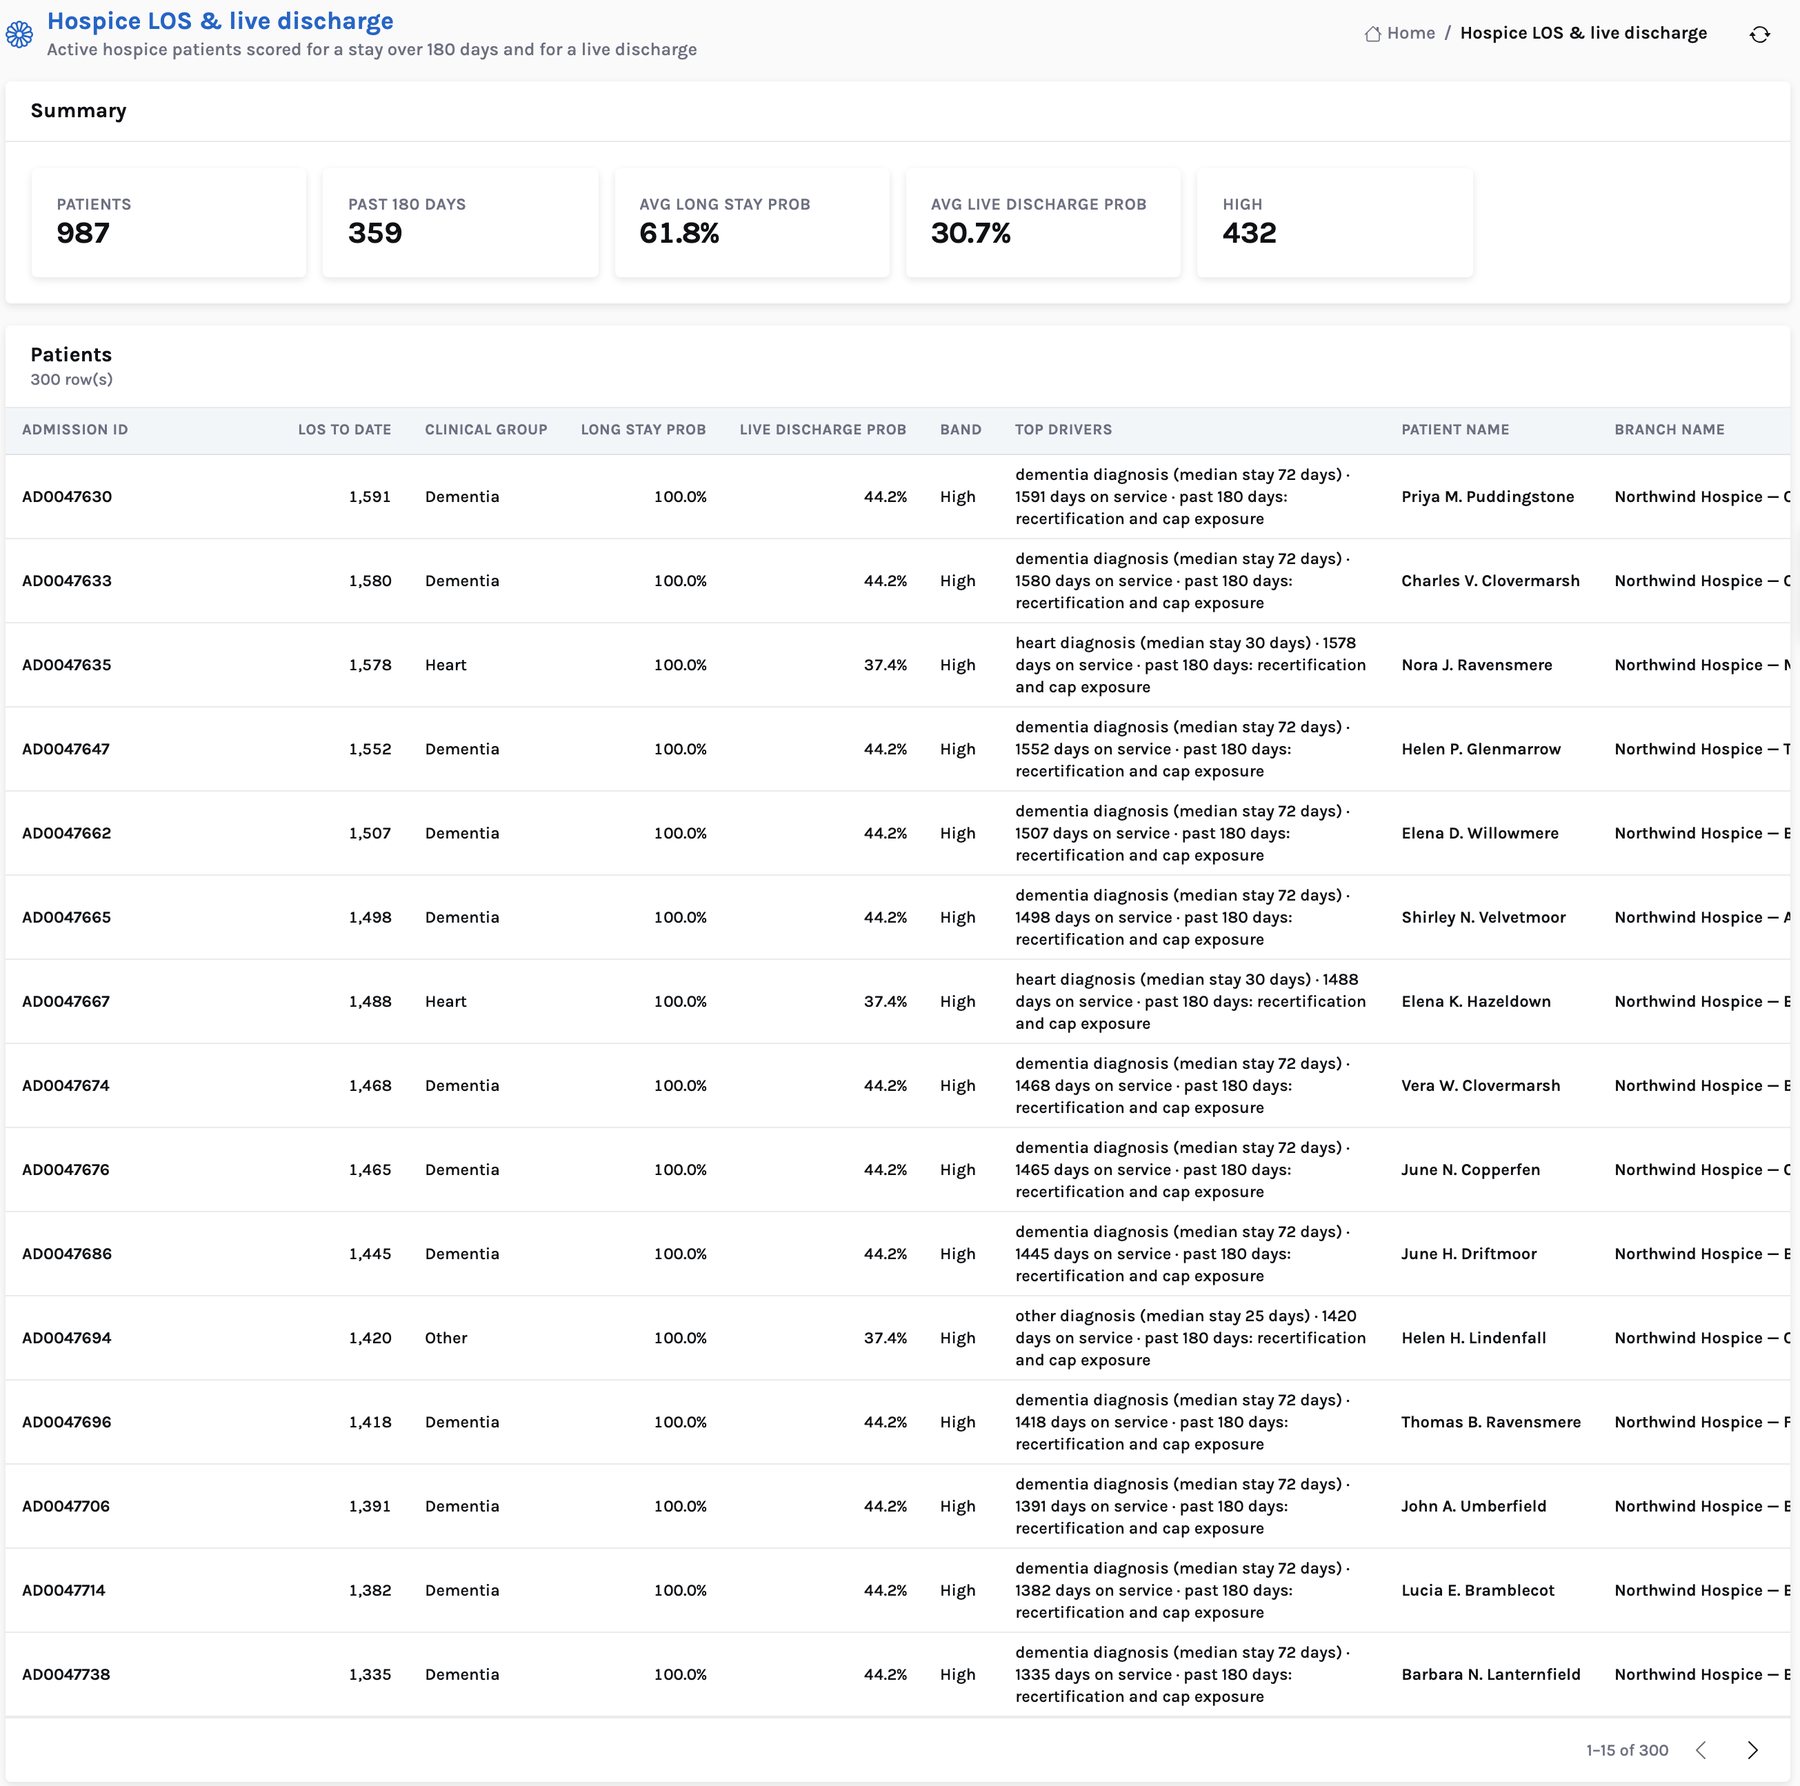
Patients past 180 days and those likely to be discharged alive, with diagnosis, days on service and the recertification and cap exposure behind each flag.
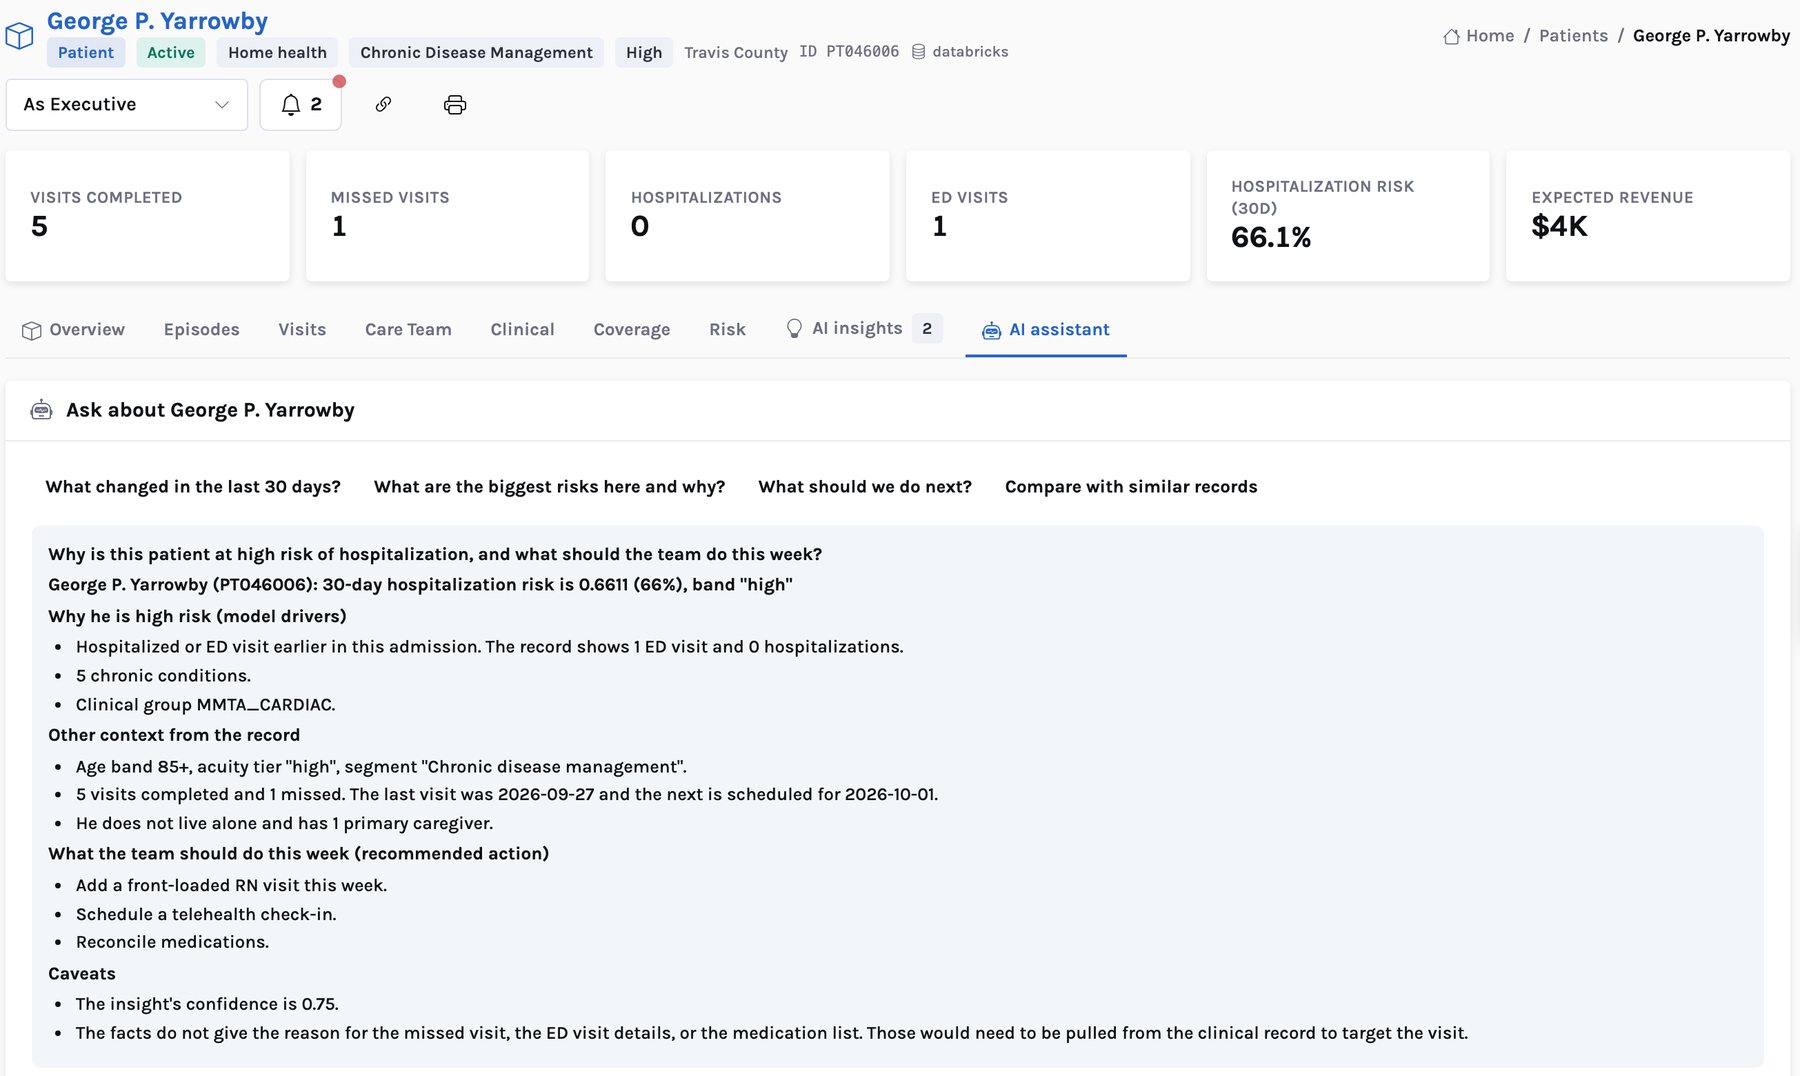
On any 360, the assistant answers from that entity's governed data: the drivers, the context, the action — and what the data does not cover, so nobody acts on a guess. The patient is synthetic.
In the demo build, insights, risk scores, copilot matches and recommendations are generated by transparent rules and formulas over synthetic data, not by models trained on real outcomes. Assistant answers are live LLM output over the demo data. In a pilot, the scores are trained on your own history.
Referrals & intake · Staffing & scheduling · Clinical quality · Revenue cycle · Hospice · Branch P&L · Payer mix · Competition
Every referral is tracked from intake to start of care. Of 7,344 declines in twelve months, 3,044 were for no staff available — the largest reason, and the most controllable. The app prices each at the expected revenue for its service line and payer.
The referral you could not staffDemo agency, all 150 branches. Bar widths proportional to referrals.
Home Care 360 loads the public CMS Care Compare files — 2,515 home health agencies and 1,060 hospices in the demo agency's counties, with 84,075 star, outcome and survey values — and compares each branch with the agencies in its county. The demo's gap is specific: team communication and professionalism score above the county, while “rated the agency 9 or 10” and “would recommend” trail by more than 25 points.
Star ratings against CMS Care Compare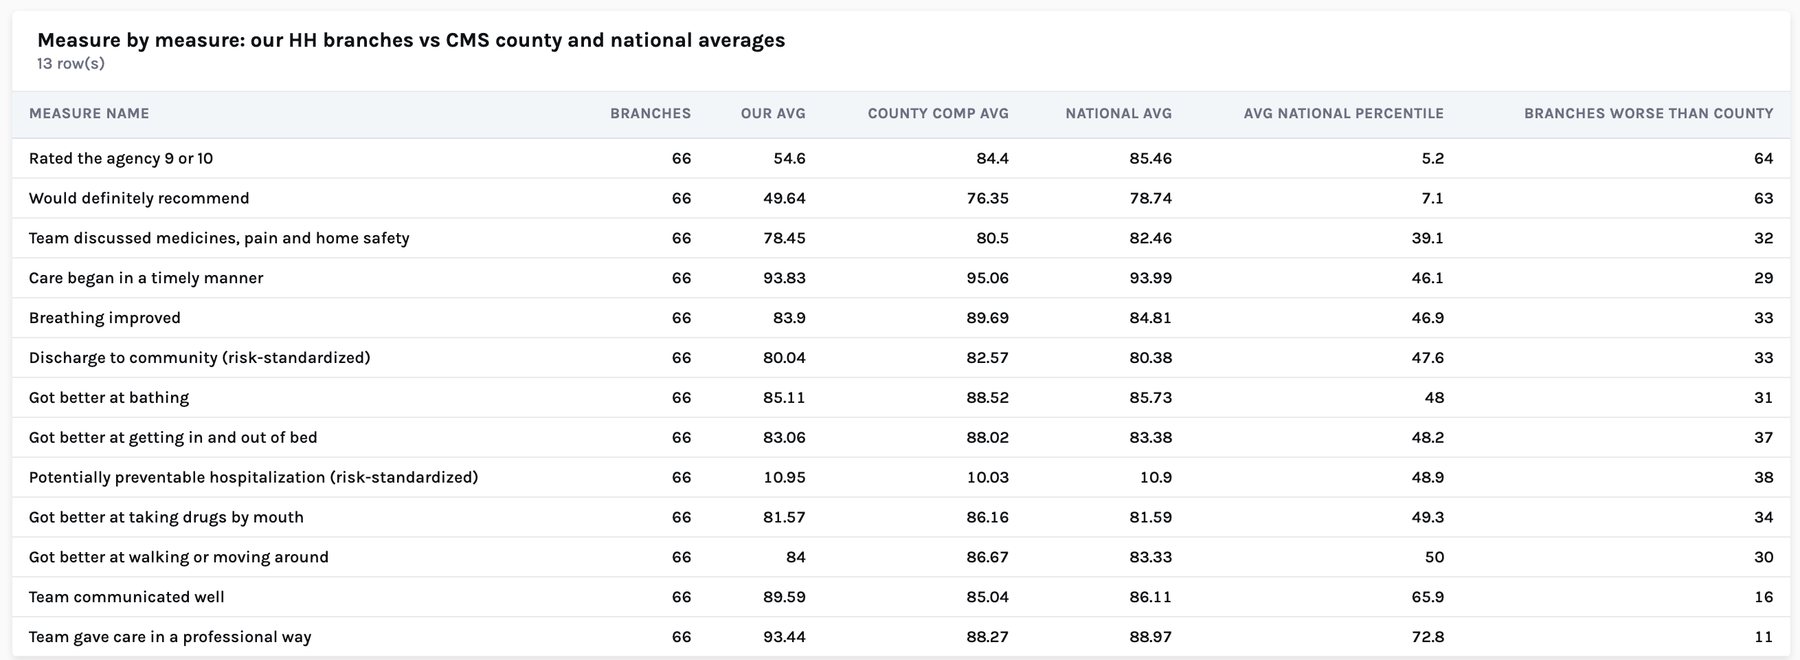
One agency, five roles, the same numbers. Times are illustrative; the figures are the demo's.
The warehouse refreshes; risk scores, copilot matches, alerts, recommendations and 155 briefs (one per role, one per branch) are written as rows and cached for the day.
She approves the copilot's top candidate for most open visits and phones to confirm; for the 238 staffed visits at high miss risk she lines up a backup.
His branch turned away 47 referrals for no staff, $535K, mostly for RNs. He takes the AI's “hire 2 RNs” to HR with the formula attached.
288 home-health patients are at high 30-day hospitalization risk. For the top of the list she adds a front-loaded RN visit and a telehealth check-in.
494 pending claims are at high denial risk. The team reconciles EVV exceptions and renews authorizations before submission.
The COO reviews the counties where patient-survey stars trail the CMS agencies most, and the branches where hiring would recapture the most referrals.
Home Care 360 is read-only. It recommends; your team acts in your EHR, scheduling, HR and billing systems. Every recommendation carries the status proposed until a person decides.
Home Care 360 is built and demonstrated today on Databricks with a synthetic agency and real CMS data. In production it is designed to run inside your workspace, reading governed tables through reviewed, read-only data contracts.
Designed to be built in your lakehouse workspace and queried in place under your permissions — no copy to a vendor warehouse. The demo uses synthetic patients; no HIPAA certification is claimed, and production runs under your BAA and security review.
Pages, briefs and the assistant only read, through named contracts. Every data-API call is logged with the caller, the contract, a parameter hash, rows returned and duration.
Heavy work runs once a night in the warehouse. Users read cached results, so page speed and compute cost do not depend on how many people log in.
It does not replace your systems of record. It sits across them and turns their output into explained decisions.
| System you have | What it does well | What Home Care 360 adds |
|---|---|---|
| EHR / clinical system | System of record for admissions, assessments, visits and plans of care | Links each patient to episodes, visits, caregivers, payer and branch; scores hospitalization, LUPA and hospice risk |
| Scheduling & EVV | Builds the schedule and verifies visits | Ranked candidates for every open visit and backups for fragile ones, with the reasons |
| HR & applicant tracking | Headcount, pay, hiring pipeline | 90-day leaving risk with drivers; hiring needs priced from lost referrals |
| Billing & clearinghouse | Submits claims, posts remits | Denial risk before submission, authorization burn-down, preventable-denial patterns by payer |
| BI dashboards | Show what happened, for analysts | Say what to do next, for every role, benchmarked against CMS agencies in the county |
Start with one region and your own data. Finish with a measured answer against a matched control region.
For CIO, COO and CFO leadership: where the value is, the AI layer, the CMS benchmark, the architecture and the 90-day pilot plan.
A 45-minute walkthrough of the demo agency — the referral leak, the copilot and the CMS county benchmark — then a pilot plan for one region.
Home health • Hospice • Personal care • Pediatric private-duty nursing