
Every home-care operator knows the arithmetic. If you hire a caregiver for every one who leaves, headcount stands still, and so do admissions. In the demo agency, 1,210 caregivers were hired in the last twelve months and 1,261 left. The workforce shrank while referrals kept coming.
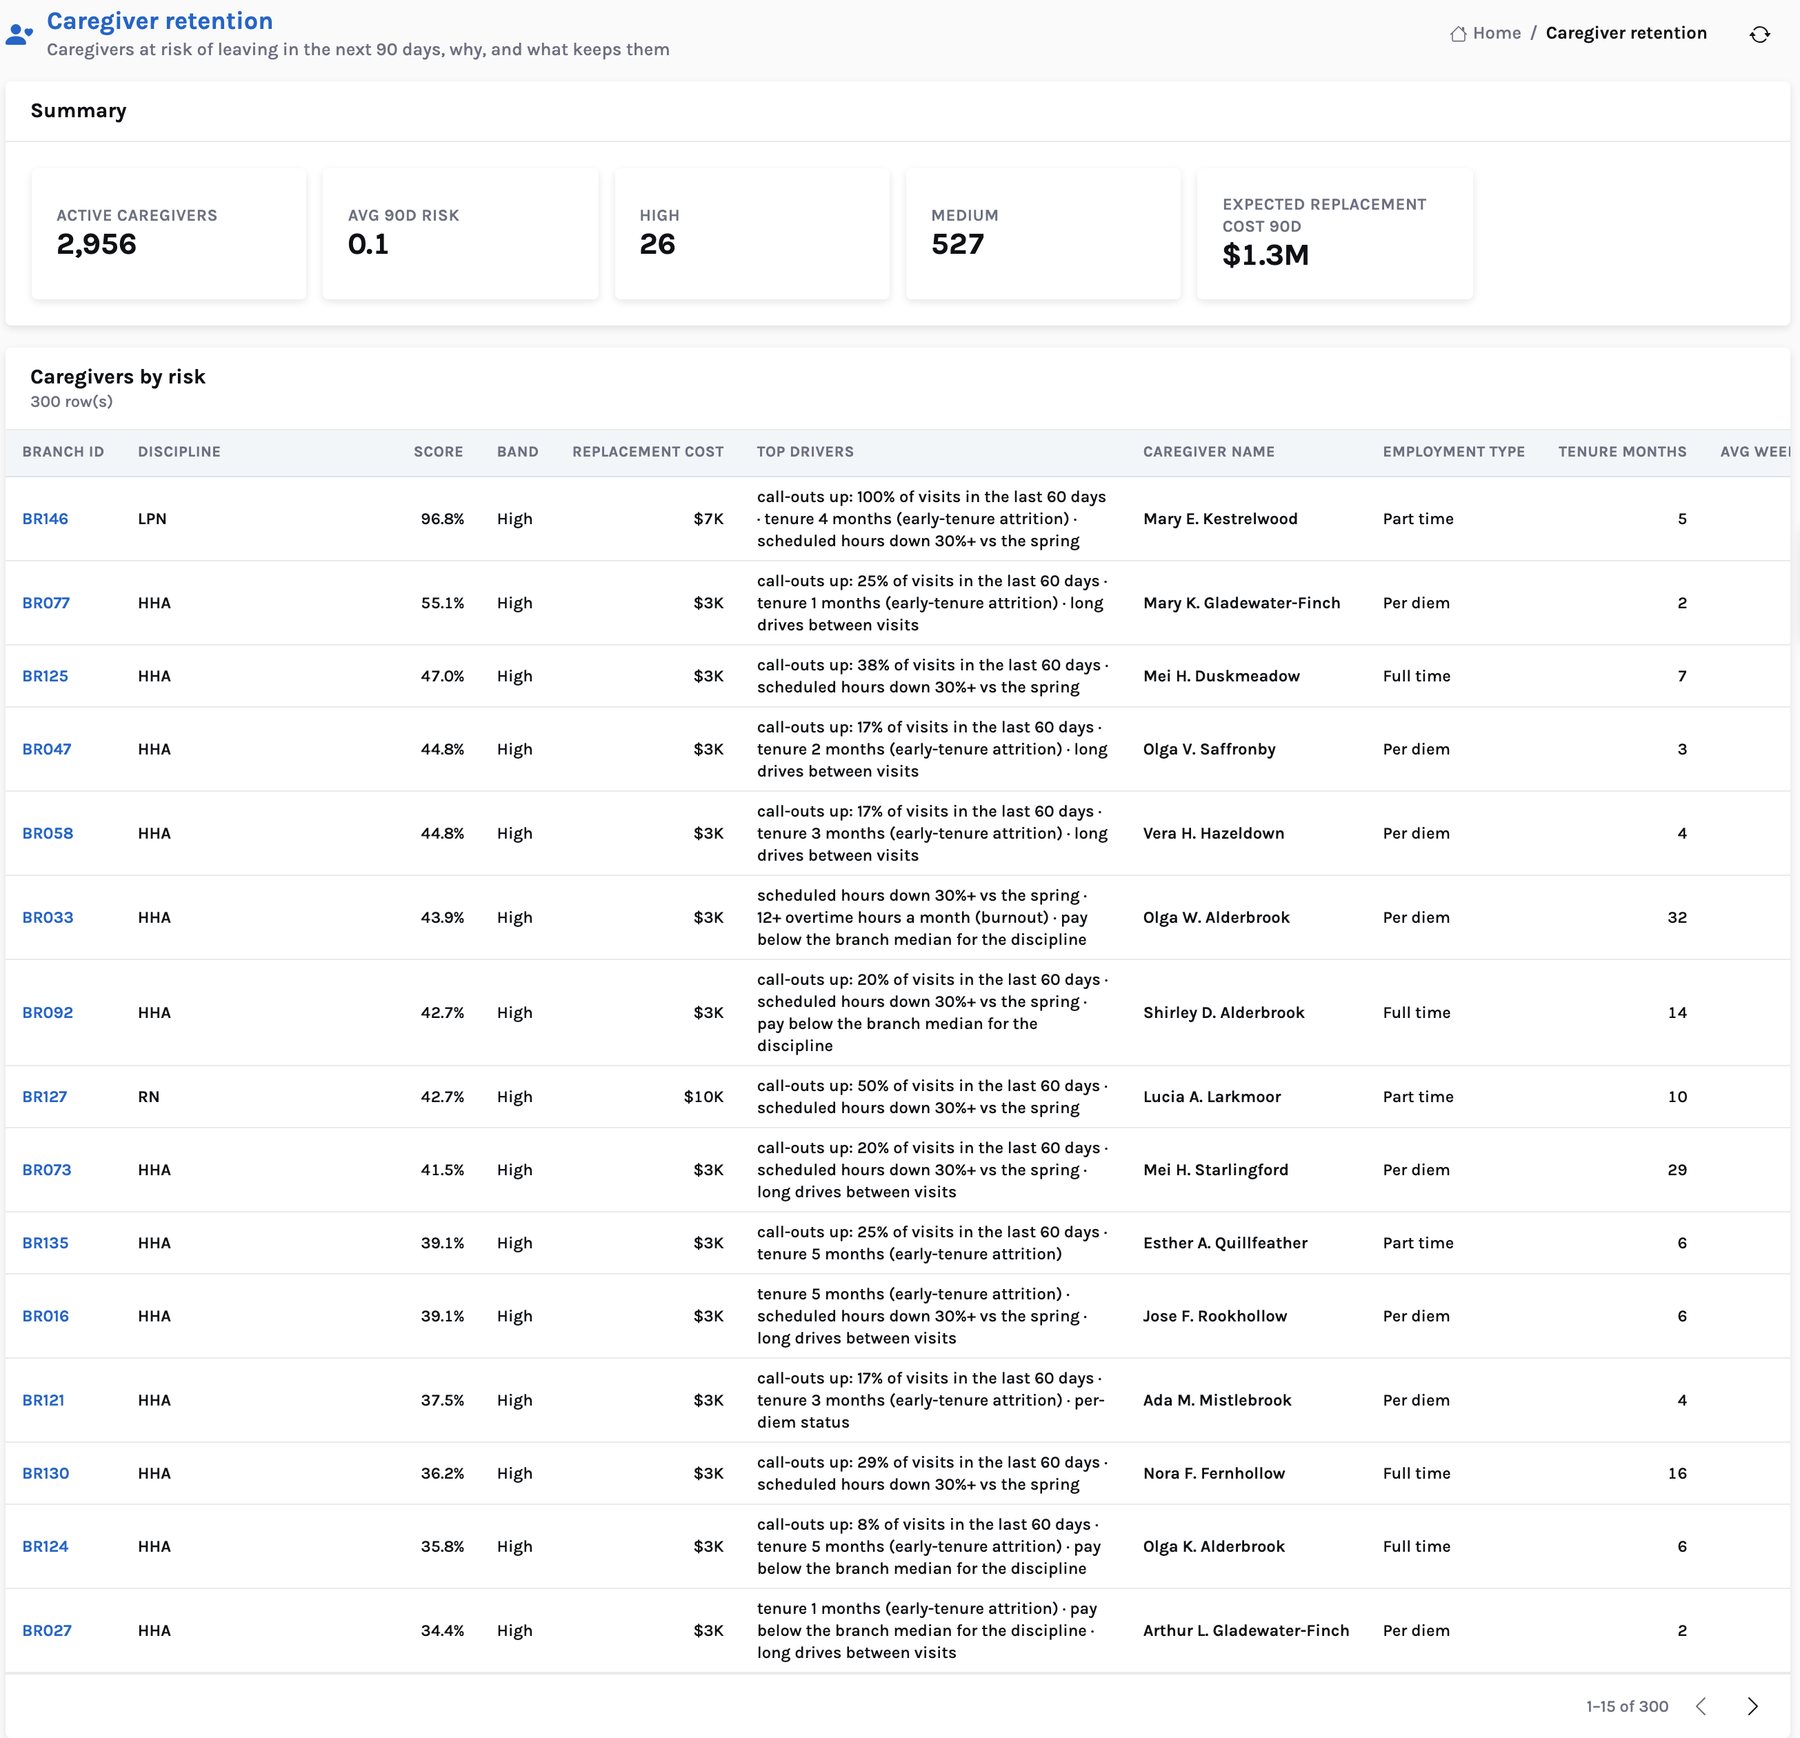
Recruiting gets most of the attention because it is visible: job posts, applicants, start dates. Leaving is quieter. A caregiver starts calling out, picks up fewer hours, gets routed across town, and resigns a month later. The signals were in the schedule and payroll the whole time. Home Care 360 reads them every night, scores every active caregiver for the risk of leaving in the next 90 days, and says why.
Where turnover lives
Annualized turnover across the agency is 42%. The average hides the shape: aides turn over at 53% a year, licensed clinicians at 27%. Aides are also most of the workforce, so they carry most of the churn and most of the open visits.
Terminations in twelve months ÷ average active headcount. Aides also hold 1,559 of the 2,403 open visits in the next 14 days; RNs hold 458.
The signals that come before a resignation
The retention score combines eight signals the agency already records. Each is a plain fact about the caregiver, not a personality judgement, and each becomes a driver on the caregiver's row when it fires:
- Early tenure. Under six months on the job — the most common driver.
- Call-outs rising. The share of visits called out in the last 60 days — the strongest single signal.
- Hours cut. Scheduled hours down 30% or more against the spring.
- Long drives. An average drive between visits of more than 28 minutes.
- Pay below the branch median for the same discipline.
- Overtime burnout. More than 12 overtime hours a month recently.
- Per-diem status, and a branch whose turnover is above 80%.
Caregivers on the retention list with each driver among their top three. Average risk is highest where call-outs are rising (25% against 20–22% for the others).
The signals are weighted, added up and converted to a probability, and the whole curve is calibrated so the average predicted risk equals the share of caregivers who actually left in the last 90 days. That keeps the score honest: if 1 in 10 caregivers leave in a quarter, the scores across the workforce average about 10%. In the demo the average is 9.7%.
From a score to a phone call
A risk score nobody acts on is a report. Each scored caregiver gets one recommended action, an owner and a value, so the coordinator can work the list from the top.
The replacement cost by discipline ($3,200 for an aide, $6,500 for an LPN, $9,500 for an RN) and the 35% share of departures a stay interview prevents are the demo's stated assumptions; a pilot replaces them with your own.
The value is small per caregiver and large in total: 2,956 retention actions across the workforce, with an expected replacement cost of $1.27M at stake in the next 90 days. For caregivers who have already left for pay or schedule reasons, the app proposes rehire outreach — 349 of them in the demo, valued at a 20% chance of return.
Retention and the schedule are one problem
Several drivers are things the scheduler controls. Long drives come from how visits are routed. Hours cut against the spring come from how cases are assigned. Overtime comes from leaning on the same reliable people. The demo agency paid 77,753 overtime hours in twelve months, a $773K premium; the app proposes rebalancing schedules and adding per-diem coverage where the premium is concentrated.
That is why the retention list and the staffing copilot live side by side in the scheduler's brief. The copilot's score already penalises overtime and rewards continuity; the retention list says whose hours to protect and whose drives to shorten.
Headline and sections as written by the demo build for the scheduler persona, 30 September 2026.
What a pilot measures
The honest test of a retention score is whether acting on it changes who leaves. In a 90-day pilot the scores are trained on your own history, and the readout compares 90-day turnover among flagged caregivers who got a stay interview with flagged caregivers who did not, in a pilot region against a control region. Home Care 360 proposes; HR and the branch decide. Nothing is written to your HR or scheduling systems.
Next: how the agency looks from the outside, on CMS Care Compare. Or see the Home Care 360 product page.
Home Care 360: grow admissions, fill every visit and keep your caregivers
Where the value is, the AI layer, the CMS benchmark, the lakehouse architecture and the 90-day pilot, for CIO, COO and CFO leadership.