
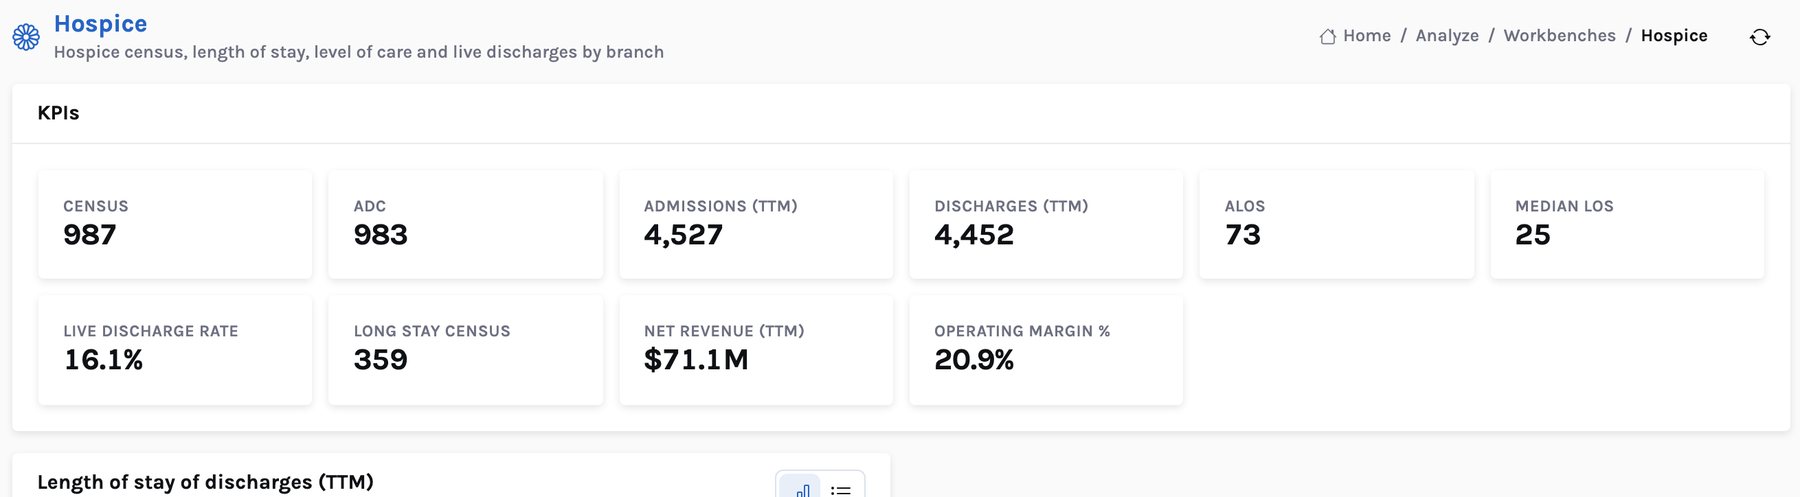
Hospice is often a home-care operator's best business. In the demo agency it is: 36 branches, 987 patients in care, $71.1M of net revenue and a 20.9% operating margin. Its risk does not show in the averages. It shows in the shape of the length-of-stay curve.
Most hospice patients are referred late and stay a few weeks. A smaller group stays for many months. That long tail is where Medicare benefit-period recertifications, face-to-face encounters and the aggregate cap concentrate, and where patients are most likely to be discharged alive. Home Care 360 scores every active hospice patient for both a long stay and a live discharge, and gives the interdisciplinary group (IDG) a review list with the reasons.
The shape of the curve
An average three times the median is the signature of a skewed distribution. Of 4,452 hospice discharges in twelve months, more than half came within 30 days. But the 398 patients who stayed past 180 days pull the average up — and they behave differently.
Length of stay in days. 4,452 discharges; 716 alive (16.1%). Demo agency, all hospice branches.
Up to six months, between 12% and 16% of discharges are live discharges — patients who revoke the benefit, move, transfer or stabilise. Past six months the share jumps to about 40%. Long-stay patients are where a hospice should look hardest at eligibility and documentation, because that is where an auditor will.
Why patients leave hospice alive
Average length of stay of each group at discharge.
Patients discharged as no longer terminally ill had been on service for 233 days on average. They are the clearest example of what the long-stay review is for: a patient whose prognosis has changed should be recognised at recertification, not months later.
Scoring every hospice patient
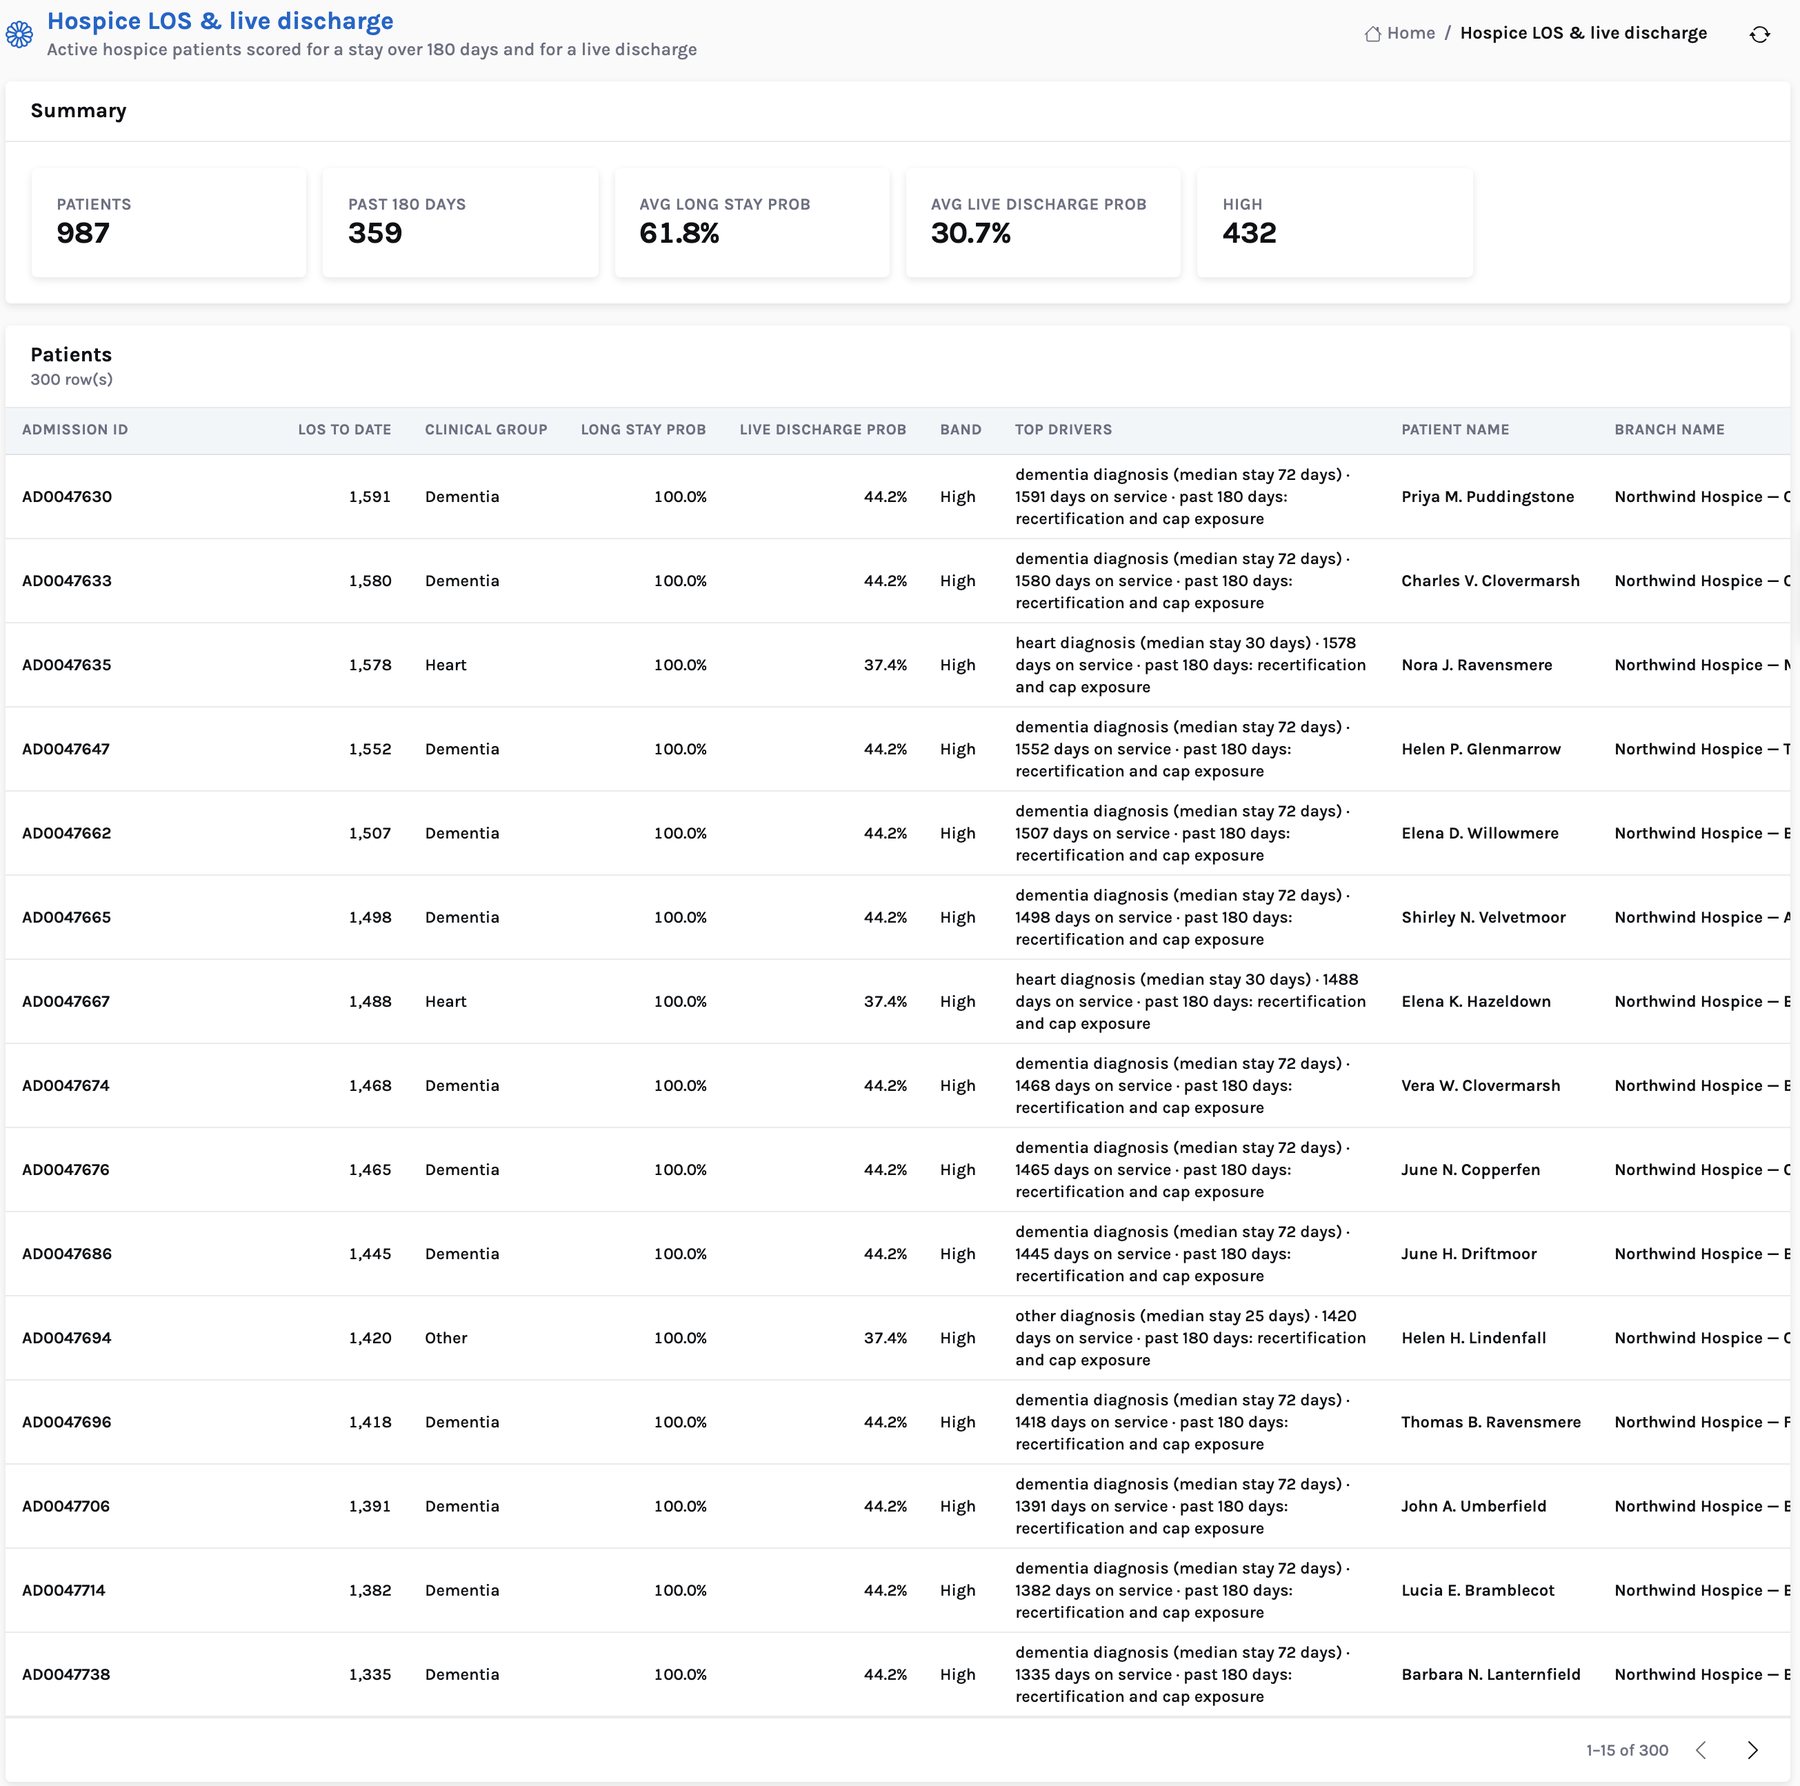
For each of the 987 patients in hospice care, the app estimates two probabilities: a stay longer than 180 days, and a live discharge. The inputs are the primary diagnosis group and the days on service so far, read against a typical length-of-stay curve for that diagnosis. In the demo, dementia patients have a typical stay of 72 days, heart failure 30, lung disease 26 and cancer 15.
Dementia dominates the high-risk list: 190 of the 300 patients at the top of it. That matches the clinical reality of hospice — dementia trajectories are the hardest to prognose — and it tells the IDG where documentation of decline matters most.
What a long stay means for revenue
Medicare pays hospice by the day, at a higher routine-home-care rate for the first 60 days of an election and a lower rate after. For FY2026 the national rates are $230.83 a day for days 1–60 and $181.94 a day from day 611, before wage adjustment. Continuous home care, inpatient respite and general inpatient care are paid at their own rates. In the demo, routine home care is 99% of hospice days.
Long stays are not bad in themselves; many patients benefit from earlier hospice. But they lower the average daily rate, they raise each beneficiary's share of the agency's Medicare aggregate cap, and they are where eligibility is most likely to be questioned. The app does not compute the cap — that needs the full Medicare cap-year data — but it flags every patient past 180 days as cap exposure for the finance team to review.
Variation between branches
The branch view is where the IDG conversation becomes a management one. Across the 36 hospice branches, average length of stay runs from 42 to 98 days and the live-discharge rate from 7.8% to 25.2%. A branch at 25% live discharges with a long average stay has a different admissions pattern from one at 8% — and the Hospice workbench lists both, with census, long-stay census, level-of-care days and the Hospice Care Index, side by side.
From a flag to the IDG agenda
Nothing here changes a patient's care automatically, and nothing should. The app makes sure the right patients are discussed, with the facts in front of the team. In a pilot, the scores are trained on your own hospice history and the readout is the share of long-stay patients reviewed before recertification.
Last in the series: one data model and an AI layer on the lakehouse. Or see the Home Care 360 product page.
Source. 1. CMS, FY2026 Hospice Wage Index and Payment Rate Update final rule (CMS-1835-F), 90 FR 37404, 5 August 2025, Tables 1–2: routine home care days 1–60 $230.83, days 61+ $181.94; continuous home care $1,674.29 per 24-hour day; inpatient respite $532.48; general inpatient $1,199.86 (hospices that report quality data). The demo prices its synthetic hospice days from these rates.
Home Care 360: grow admissions, fill every visit and keep your caregivers
Where the value is, the AI layer, the CMS benchmark, the lakehouse architecture and the 90-day pilot, for CIO, COO and CFO leadership.