
Revenue-cycle teams in home care spend most of their week on claims that have already gone wrong: denials to appeal, write-offs to approve, authorizations that ran out while visits continued. Most of that work is avoidable, because most of the causes were visible before the claim was submitted.
Home Care 360 moves the revenue-cycle view upstream. It scores every pending claim for denial with the likely reason and the fix, projects every active authorization to the day it runs out, and checks every open home-health period against its PDGM visit threshold while there is still time to schedule the visits.
Where the money goes between gross and net
The demo agency billed $175.9M of expected revenue in twelve months. $9.9M was written off, leaving $166.0M of net revenue. Denials are the main path from one to the other: 5,552 denials worth $13.8M, a denial rate of 9.3% and an average of 28 days to pay. Some denied dollars are recovered on appeal; the rest become write-offs.
Net revenue = expected (allowed) revenue of episodes starting in the period minus denial write-offs — one definition used on every page.
Most denials are preventable — if you look first
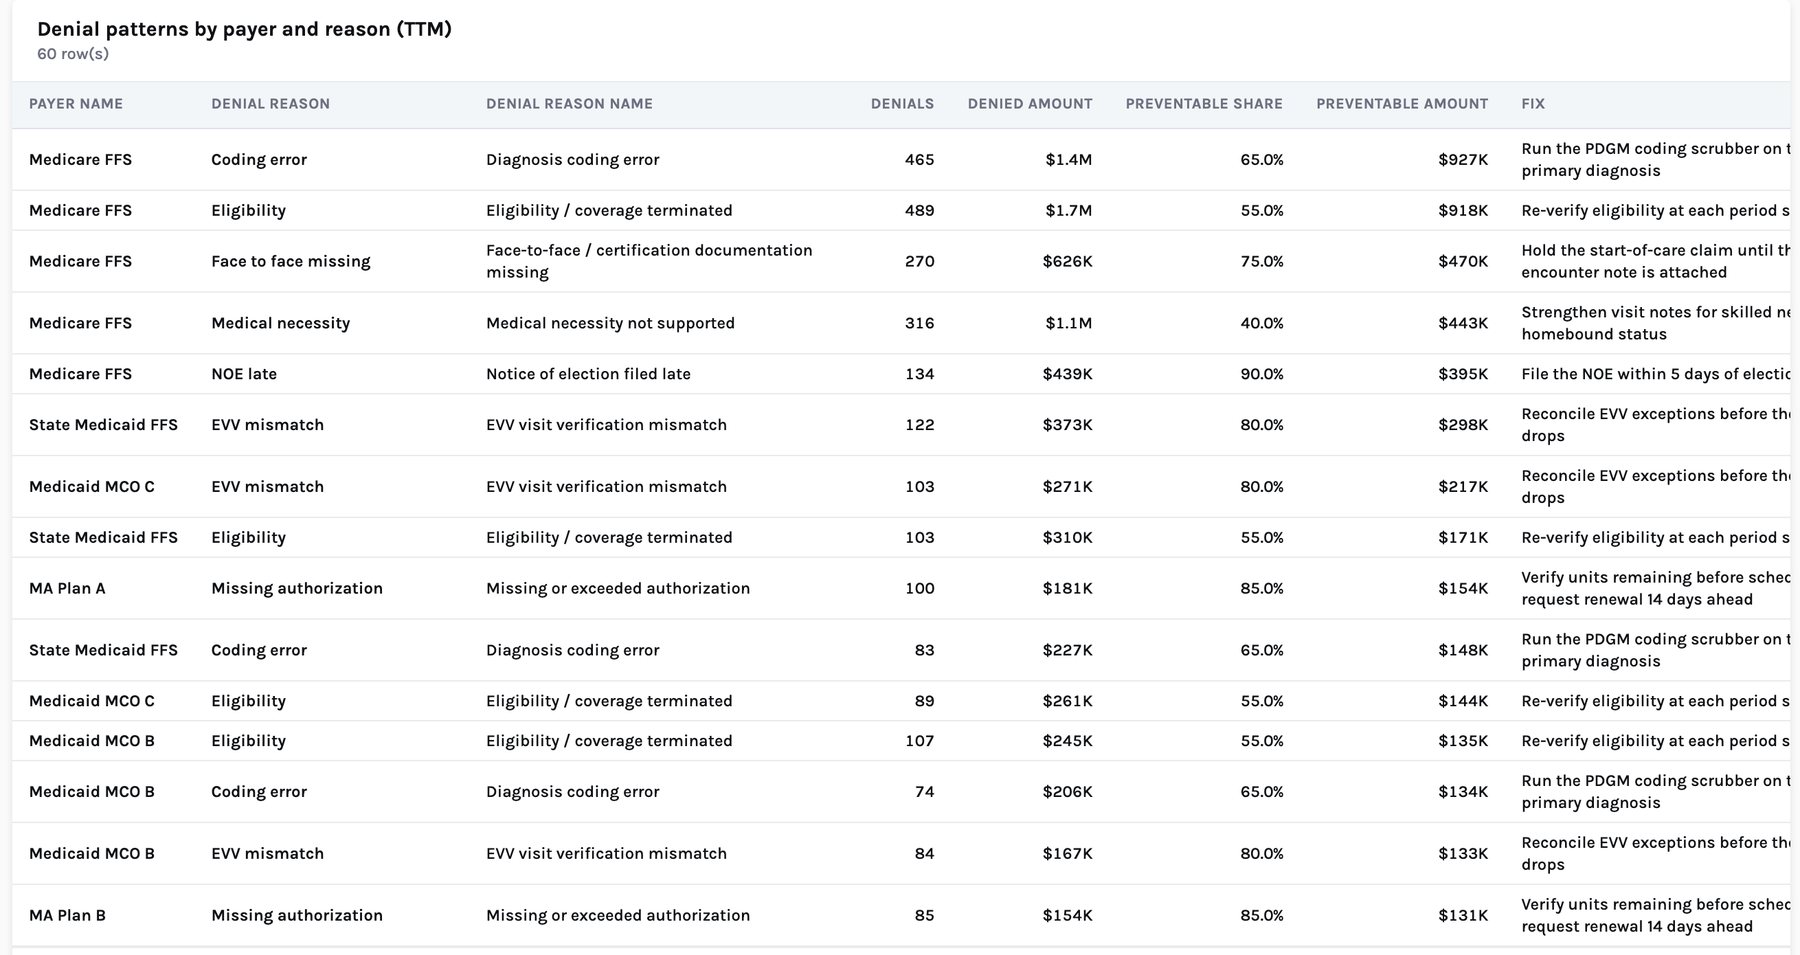
Each denial reason has a typical fix and a typical share that a front-end check would have prevented. The shares are the demo's stated assumptions, set per reason; in a pilot they come from your own remittance and appeal history. Applied to the year's denials, they say $8.4M of the $13.8M was preventable.
| Denial reason | Denied | Preventable | Fix before submission |
|---|---|---|---|
| Eligibility / coverage terminated | $3.7M | 55% | Re-verify eligibility at each period start |
| Diagnosis coding error | $3.2M | 65% | Run a PDGM coding scrubber on the primary diagnosis |
| Medical necessity not supported | $3.1M | 40% | Strengthen notes for skilled need and homebound status |
| Face-to-face / certification missing | $1.1M | 75% | Hold the start-of-care claim until the encounter note is attached |
| EVV visit verification mismatch | $1.1M | 80% | Reconcile EVV exceptions before the claim drops |
| Missing or exceeded authorization | $1.1M | 85% | Check units remaining; request renewal 14 days ahead |
| Hospice notice of election late | $478K | 90% | File the NOE within 5 days of election |
| Timely filing exceeded | $28K | 95% | Work the unbilled queue weekly |
Scoring the claim before it drops
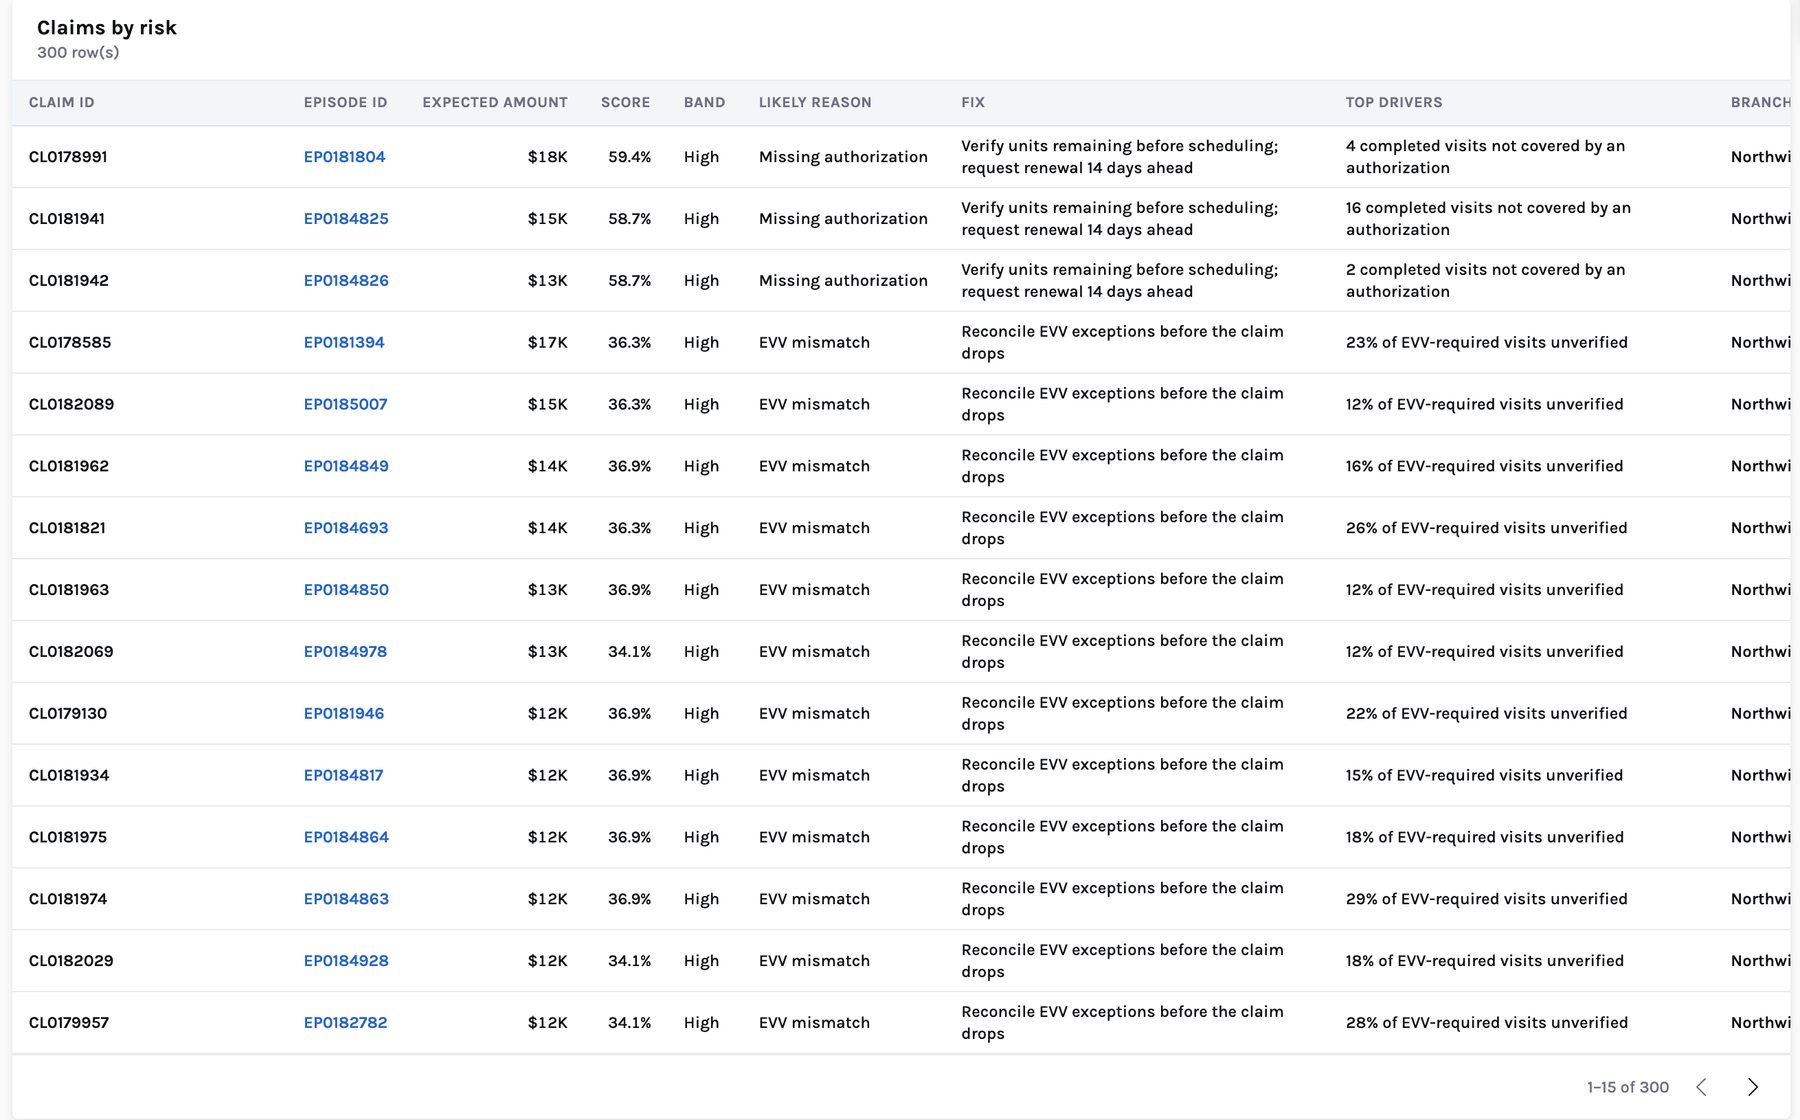
Every pending and unbilled claim — 9,154 on the snapshot date — is scored for the probability of denial, with the most likely reason, the drivers and the fix. The drivers are concrete: completed visits not covered by an authorization, the share of EVV-required visits still unverified, a missing face-to-face note, a payer with a history of eligibility denials.
Authorizations: the burn-down nobody watches
Medicaid plans, Medicare Advantage, commercial payers and the VA authorize care in units — visits for home health, 15-minute units for personal care and private-duty nursing, service days for some hospice benefit periods. Medicare fee-for-service does not use prior authorization for home health or hospice; in the Review Choice Demonstration states, home-health agencies submit pre-claim review instead1, and the Payer 360 shows those branches explicitly.
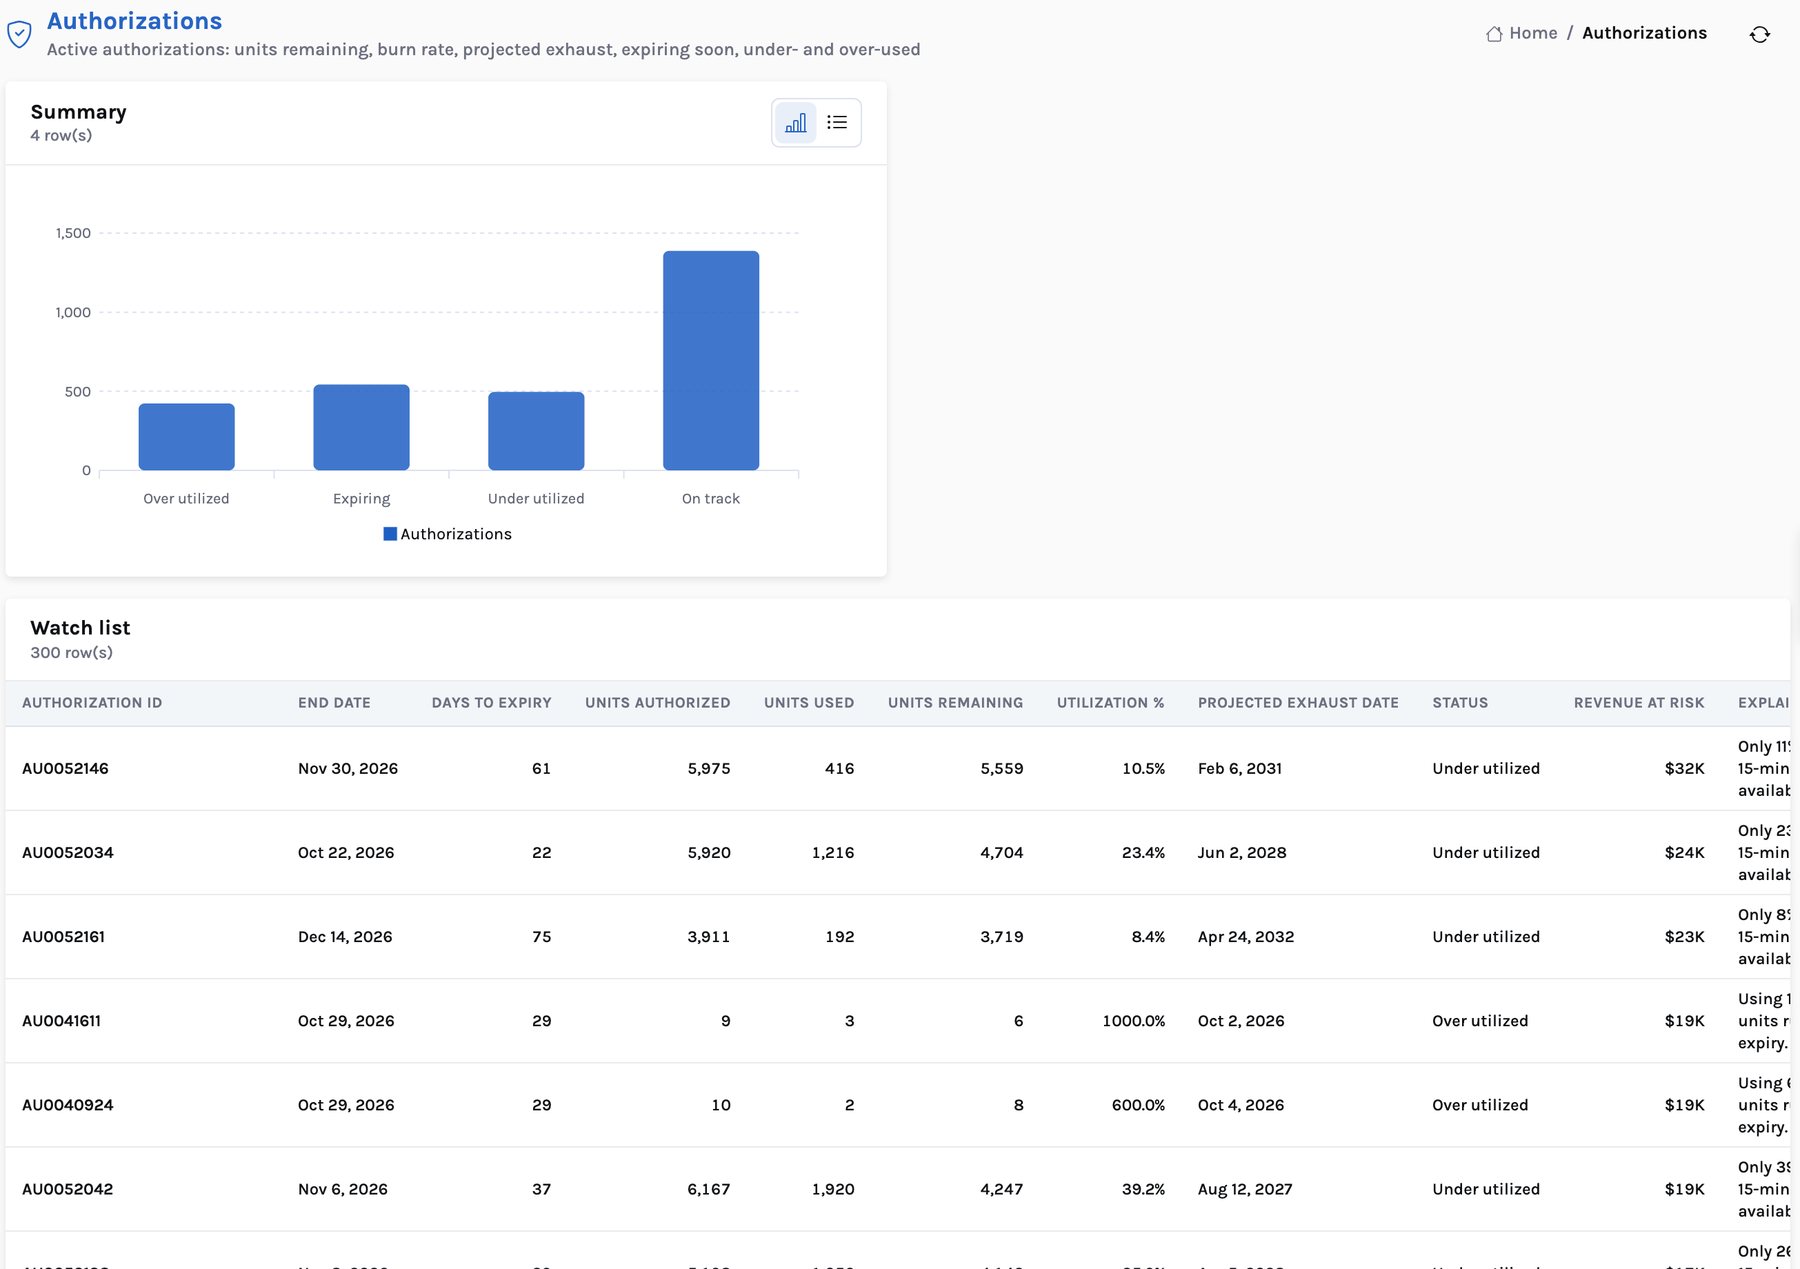
For each of the 2,850 active authorizations the app computes units used, units remaining, the burn rate and the projected exhaust date, then sorts them into four states:
Revenue at risk: care delivered or scheduled beyond the authorization (expiring, over-used), or authorized care not being delivered (under-used).
Each state has a different owner. An expiring authorization is an intake task: request the renewal now. An over-used one is a scheduling task: the patient is getting more visits than authorized, which will be denied. An under-used one is a staffing or patient-availability gap — often in private-duty nursing, where an authorization of thousands of 15-minute units is running at 10–25% of plan because shifts are not being filled.
LUPA under PDGM: count the visits before the period ends
Under the Patient-Driven Groupings Model, Medicare pays home health in 30-day periods. If a period has fewer visits than the threshold for its case-mix group, it becomes a low-utilization payment adjustment (LUPA) and is paid per visit instead of the full period payment. The demo agency's LUPA rate is 9.2% of home-health periods.
Some LUPAs are clinically right. Many are scheduling accidents: a visit missed, a patient discharged early, a therapy evaluation not booked. For each of the 1,704 open home-health periods, the app compares visits completed plus visits on the two-week schedule with the period's threshold, and estimates the probability of ending below it.
Synthetic episode at a home-health branch in Pinellas County, Florida. Period payments are priced from the CY2026 national rate, wage- and case-mix-adjusted; LUPA per-visit amounts in the demo are approximations.
Across the agency, 176 open periods are at high LUPA risk with $141K at stake, 239 at medium risk ($60K). The amounts are small next to denials, but the fix is the cheapest in the revenue cycle: book the visits that the plan of care already calls for.
The revenue-cycle morning
As written by the demo build for the revenue-cycle persona, 30 September 2026.
Home Care 360 does not submit, hold or correct claims; your billing system and clearinghouse do. It tells the team which claims to look at before they go, and why. In a pilot, the readout is the first-pass denial rate on claims scored before submission, against the prior period and a control region.
Next: hospice length of stay and live discharge. Or see the Home Care 360 product page.
Sources. 1. CMS, Review Choice Demonstration for Home Health Services (cms.gov). CMS, CY2026 Home Health Prospective Payment System final rule (CMS-1828-F), 90 FR 55342: national standardized 30-day period payment $2,038.22, used to price the demo's synthetic periods.
Home Care 360: grow admissions, fill every visit and keep your caregivers
Where the value is, the AI layer, the CMS benchmark, the lakehouse architecture and the 90-day pilot, for CIO, COO and CFO leadership.