
A discharge planner choosing a home health agency for a patient, and a family choosing a hospice, often look at the same page: CMS Care Compare. Every Medicare-certified agency is there, with its star ratings, its outcomes and what its patients said about it. Your competitors' numbers are public. So are yours.
Most agencies track their own stars. Fewer know, county by county, where they stand against the agencies their referral sources are comparing them with — or which two or three measures are pulling the star down. Home Care 360 answers both from the public CMS files.
Loading the public truth
CMS publishes provider-level files on its Provider Data Catalog: home health agencies with their quality star rating and outcome measures, the home health patient survey (HHCAHPS) with its summary star, and hospice general information with the Hospice Care Index. Home Care 360 downloads them, assigns each agency to a county from its ZIP code, and keeps the agencies in the counties where the operator has branches.
Each competitor becomes an entity with its own 360 — profile, measures, survey results and the operator's branches in the same county — keyed by its CMS Certification Number. Because the competitor and the county sit on the same data model as the operator's branches, every comparison is like for like: same county, same measure, same CMS scale.
The headline: level on quality, behind on experience
On average, the demo agency's clinical quality is level with its competitors. Its patients' view of it is not. That distinction matters, because the two stars have different fixes: one is about clinical process, the other about how care feels to the patient and family.
County by county
An average across 52 counties hides the counties that matter. A referral source in one county is comparing the operator's local branch with the local competitors, not with the national picture.
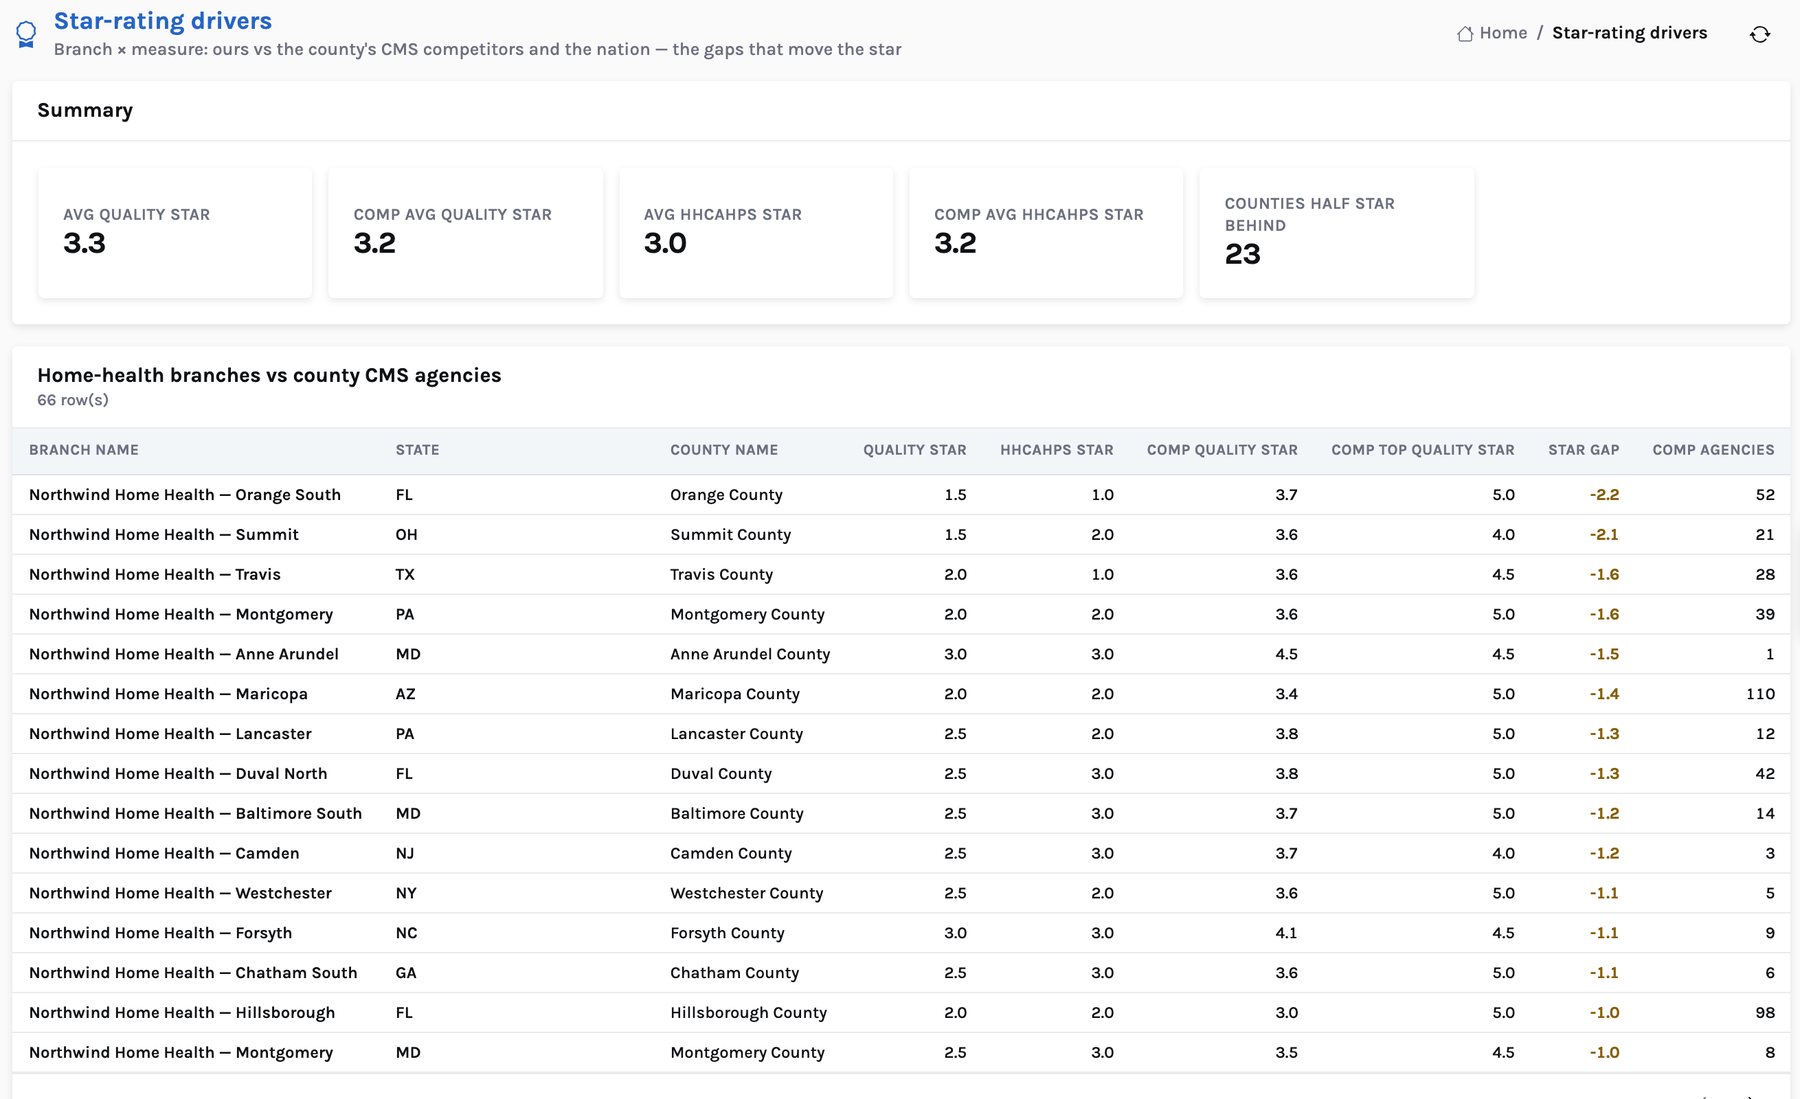
Northwind: synthetic, on the CMS scale. Competitors: average CMS quality-of-patient-care star of the home health agencies located in each county (count shown); October 2026 release. Counties with one or two agencies compare against very few peers.
Some gaps are small and noisy, some are not. In Summit County, Ohio, the operator's branch holds 1.5 stars against a 3.6-star average for 21 local agencies. In Travis County, Texas, it is 2.0 against 3.6 across 28. In other counties the branch leads: 4.5 stars against 3.0 in one Virginia county, 4.0 against 3.0 in Tarrant County, Texas. A regional director gets a map of where to defend and where to attack.
Which measures move the star
A star is a summary. To change it you need the measures underneath. The Competition workbench compares every home-health branch with the county CMS average and the national average on thirteen measures, and counts how many of the 66 branches trail their county.
Percent of patients or episodes; axis 40–100. Number on the right = Northwind minus the county average, in points. Higher is better for every measure shown.
This is the most useful finding in the demo, and it would be invisible without the competitor data. Patients rate the care team above the county on communication (89.6 vs 85.0) and professionalism (93.4 vs 88.3). But only 54.6% rate the agency 9 or 10, against 84.4% for the county, and 49.6% would definitely recommend it, against 76.4%. 64 of 66 branches trail their county on the first and 63 on the second.
A gap that specific is fixable. Clinicians are not the problem; something about the agency experience is — scheduling reliability, missed and late visits, who answers the phone. That points straight back to the schedule and the caregiver churn behind it.
From a gap to an action
For each branch half a star or more behind its county, the app writes a recommendation: the measures to focus on, the owner (the clinical manager and branch director) and a value. The value rests on a stated assumption — referral revenue rises about 3% for each half star closed — so a branch director can challenge it. In the demo there are 27 such actions worth about $1.0M a year.
Every insight of this kind is labelled with its source. Facts about the operator say “agency data”; facts about competitors say “CMS Care Compare”, with the release the values came from. Nothing about a competitor is estimated or invented.
What this does not cover yet
- CAHPS Hospice. The hospice files loaded carry the Hospice Care Index and quality measures, but not the CAHPS Hospice survey, which CMS publishes as a separate dataset. Hospice competitors show an explicit “not applicable” row for the patient survey.
- Referral-source choice. The app does not know which agency a declined referral went to. It knows the county's competitors and their stars.
- Your own stars. In a pilot, the operator's real CMS ratings and measures replace the synthetic ones, from the same public files.
Next: denials, authorizations and LUPA. Or see the Home Care 360 product page.
Sources. CMS Provider Data Catalog (data.cms.gov/provider-data): Home Health Care Agencies, October 2026 release; Home Health Care – Patient Survey (HHCAHPS), 2025 Q2 – 2026 Q1; Hospice – General Information and Hospice – Provider Data, August 2026 releases. County assignment uses the US Census 2020 ZCTA-to-county relationship file.
Home Care 360: grow admissions, fill every visit and keep your caregivers
Where the value is, the AI layer, the CMS benchmark, the lakehouse architecture and the 90-day pilot, for CIO, COO and CFO leadership.