
Ask a home-care operator what limits growth and the answer is rarely demand. Hospitals, physician practices and skilled nursing facilities keep sending referrals. The referral is lost at intake, when nobody can say which nurse or aide will start care this week, and the case goes to the next agency on the list.
That loss rarely shows up anywhere. The referral was declined, so it never became a patient, an episode or a claim; it sits in an intake log with a reason code. Home Care 360 starts there. It counts the referrals declined for lack of staff, prices each one, turns the total into a hiring plan by branch and discipline, and then helps the scheduler keep the caregivers you already have on the visits that need them.
Where the referral funnel leaks
Every referral in the demo agency is tracked from intake to start of care: received, accepted or declined with a reason, admitted or not. In twelve months the agency received 32,255 referrals, accepted 77.2% and admitted 69.0%.
41% of all 7,344 declines, and the one an operator controls most directly
Demo agency, all branches. Bar widths proportional to referrals.
The decline reasons tell you which part of the leak you can fix. A patient outside the service area, or one whose clinical needs exceed what the agency offers, is a strategy question. A referral declined because nobody was available to staff it is an operations question — and it is the biggest single reason by count and by value.
Expected revenue of the declined referrals: no staff $21.8M; out of service area $7.5M; clinical needs $7.2M; documentation $4.5M; payer $3.8M; not homebound $2.3M.
Pricing a referral that never became a patient
A declined referral has no claim, so the app prices it the way finance would: the expected revenue of an admission for that service line and payer, from the agency's own history. A Medicare home-health admission is paid in 30-day periods — the CY2026 national standardized rate is $2,038.22 per period before wage and case-mix adjustment1 — while hospice and personal-care cases are paid by the day or the hour and often run for months. That is why the lost dollars are not proportional to the lost count.
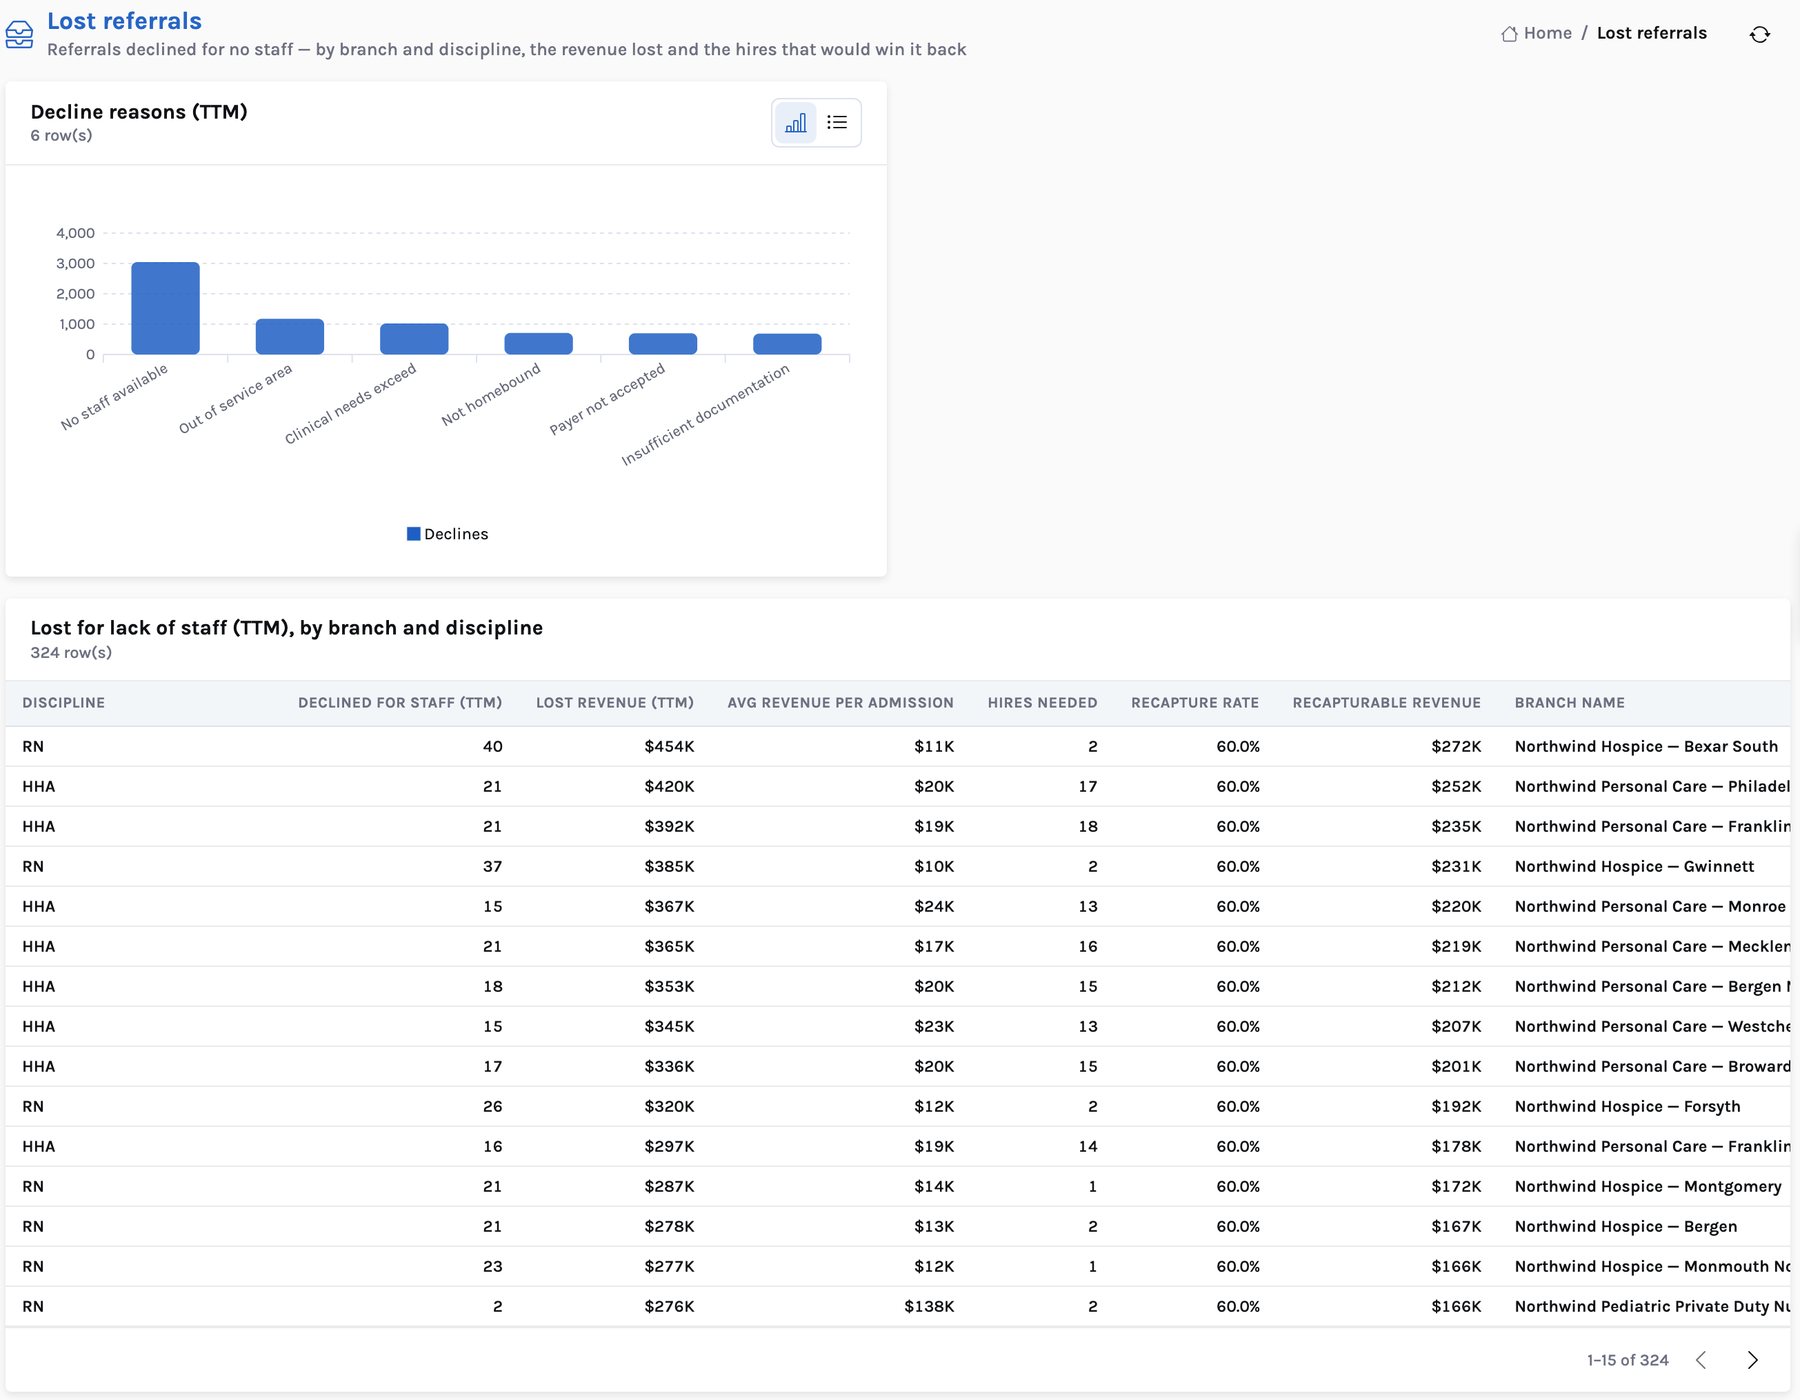
From lost revenue to a hiring plan
Knowing the leak is $21.8M is not yet an action. The useful question is: which hires, in which branches, would close it? For every branch and discipline with referrals declined for no staff, the app compares the monthly volume declined with how many admissions one caregiver of that discipline absorbs at that branch today, and rounds up to the hires needed. It then values each hire at 60% of the lost revenue — an assumption, stated on every row, that not every recovered referral would have admitted.
| Discipline | Declined | Revenue lost | Hires | Recapturable / yr |
|---|---|---|---|---|
| Registered nurse | 1,538 | $9.8M | 113 | $5.9M |
| Home health aide | 452 | $7.8M | 331 | $4.7M |
| Physical therapist | 925 | $3.1M | 66 | $1.8M |
| Licensed practical nurse | 5 | $707K | 5 | $424K |
| Occupational therapist | 91 | $304K | 46 | $182K |
| Speech-language pathologist | 33 | $109K | 26 | $66K |
| All disciplines, 148 branches | 3,044 | $21.8M | 587 | $13.1M |
The table reads two ways. Nurses carry the money: 1,538 RN referrals lost, $9.8M. Aides carry the headcount: 452 referrals, but personal-care and hospice aide cases run for months, so they cost $7.8M and need 331 hires because each aide absorbs few new cases. The hiring plan follows the work, not the averages.
Worked example: one hospice branch
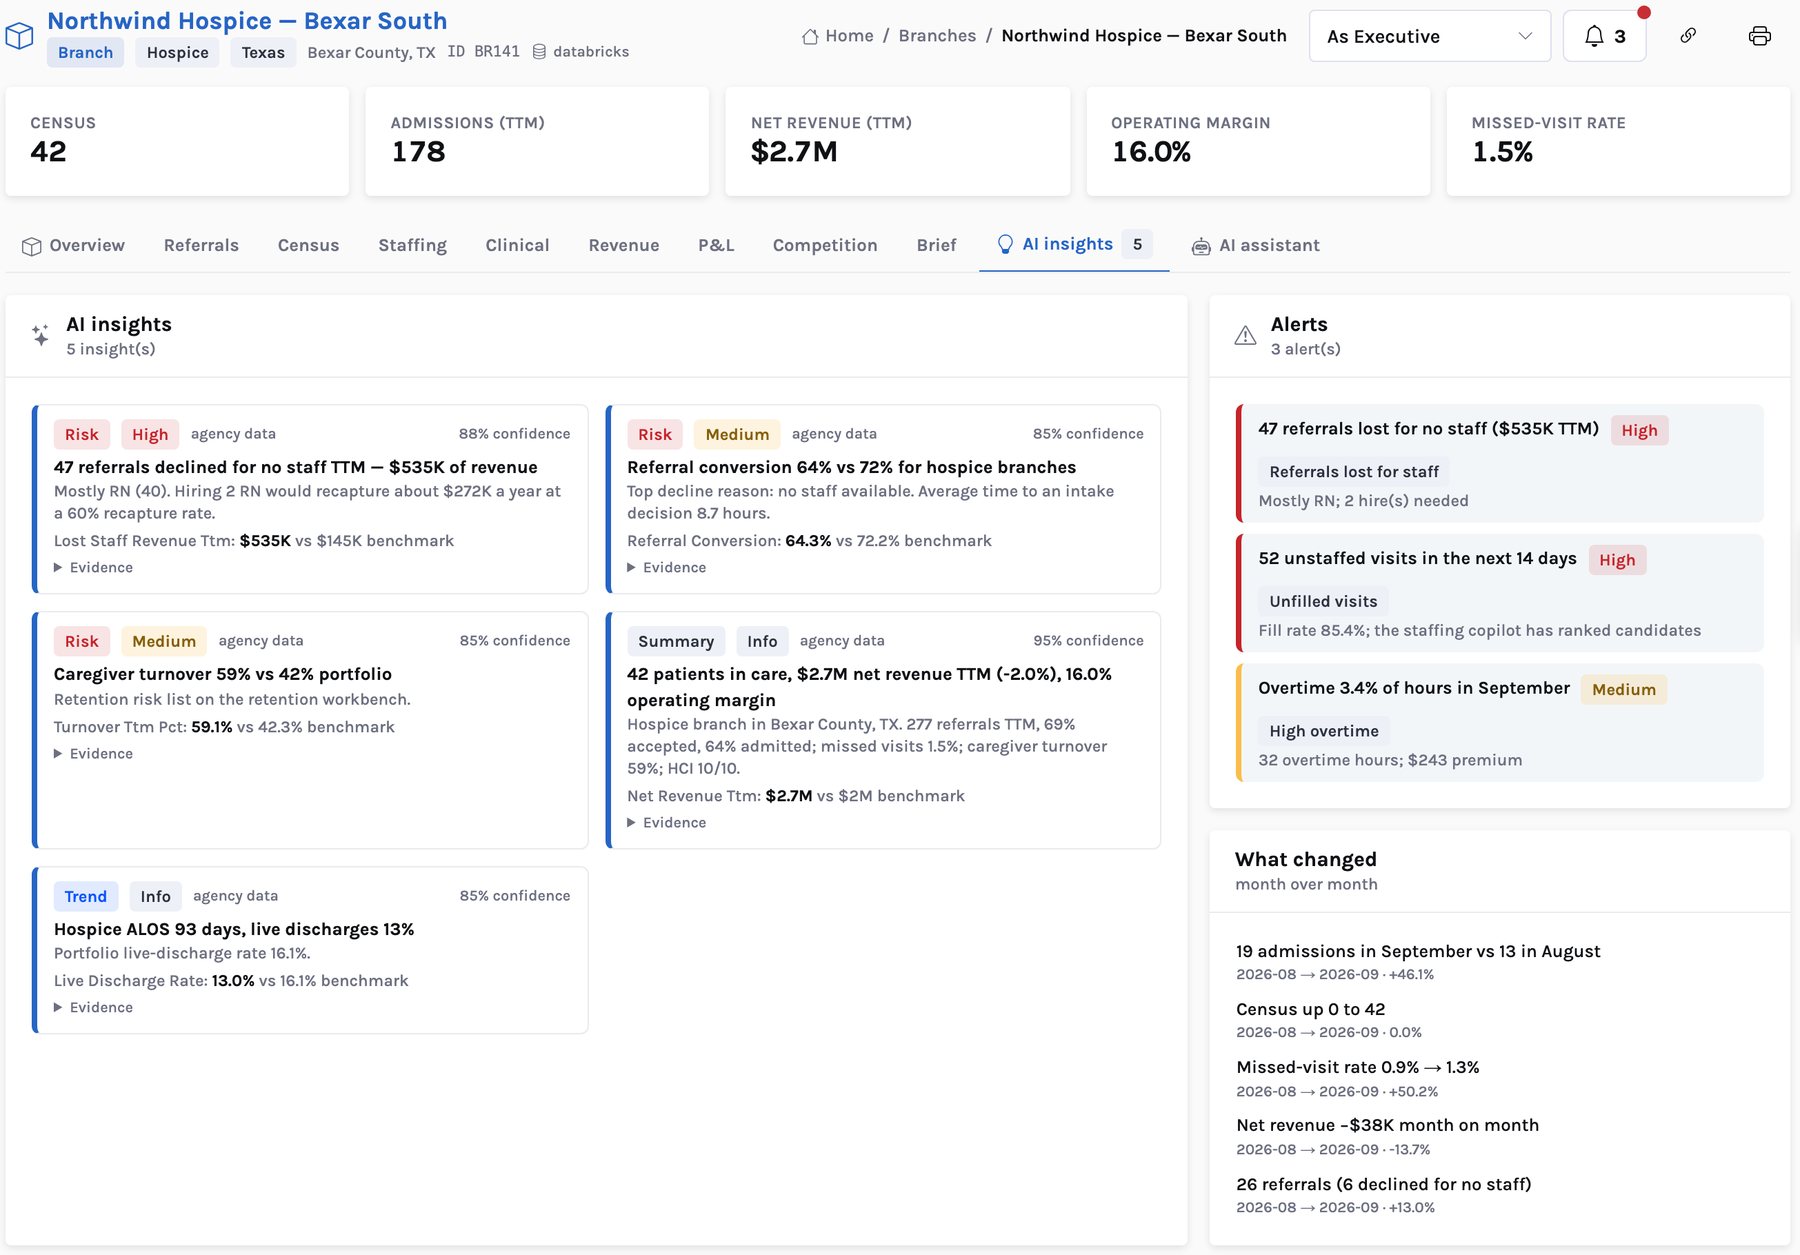
The demo's largest single leak is a hospice branch in Bexar County, Texas. In twelve months it declined 47 referrals for no staff, $535K of expected revenue, against a benchmark of $145K for the agency's branches. Forty of the 47 needed an RN. The branch's caregiver turnover is 59%, against 42% for the agency, which is part of why it cannot staff them.
The same branch also gets “hire 1 HHA” ($48K a year) and “two-hour intake decisions” ($43K), because 8 accepted referrals chose another agency before start of care.
Referral sources get the same treatment. Physician practices sent the most referrals and lost the most to staffing — 1,766 declines worth $13.4M — ahead of hospitals (752, $4.4M), assisted living (216, $2.4M) and skilled nursing facilities (310, $1.7M). Each Referral Source 360 shows its own decline history, so a liaison knows which relationships are at risk of going quiet.
Keeping the caregivers you have on the visits that need them
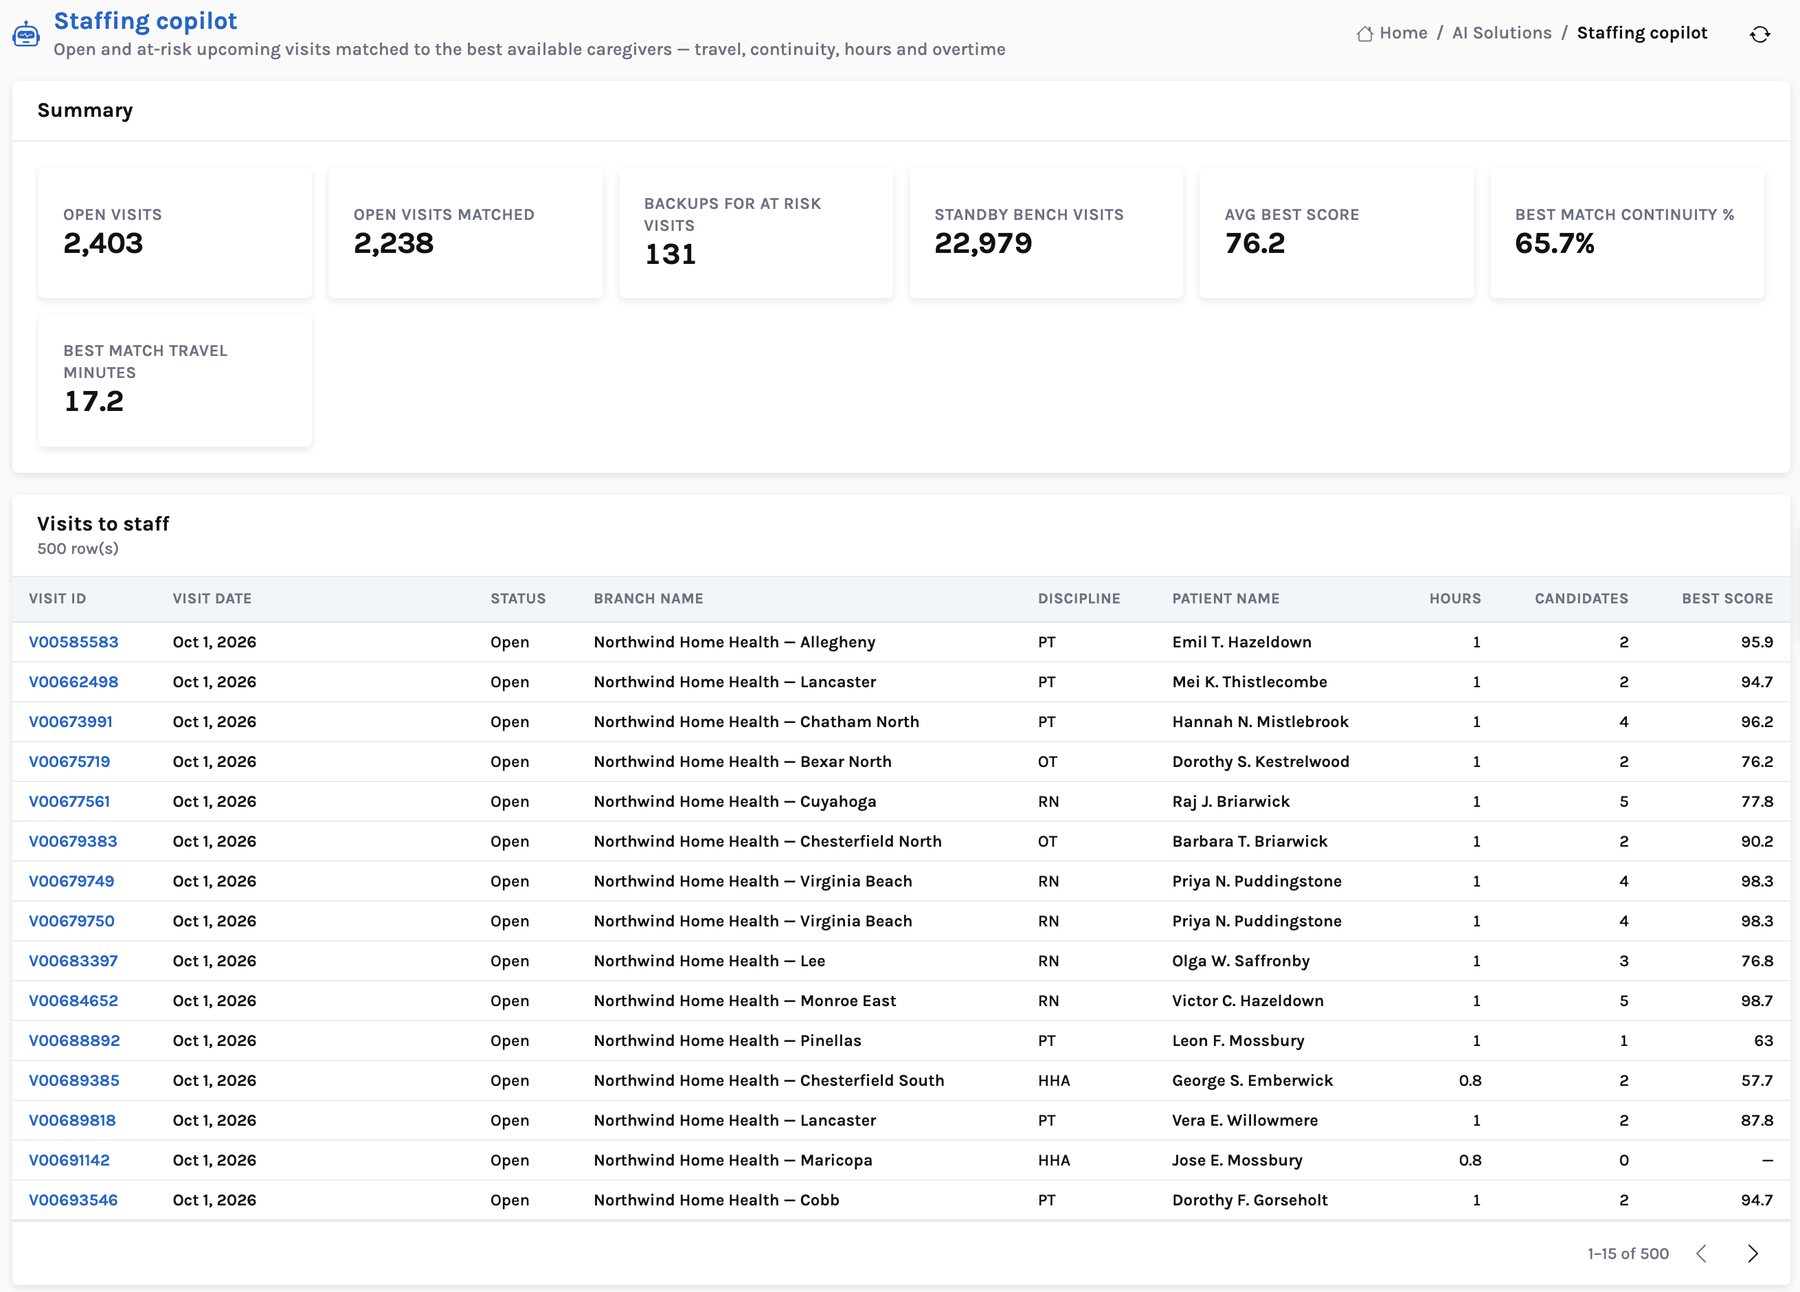
Hiring takes months. The schedule is due tomorrow. On the snapshot date the demo agency had 2,403 visits in the next 14 days with no caregiver assigned — a look-ahead fill rate of 91.5%. The staffing copilot ranks up to five available caregivers of the right discipline for each of them, and found candidates for 2,238.
How a candidate is scored
The score is out of 100 and deliberately simple, so a scheduler can check it in her head. Four things matter, weighted the way schedulers weigh them:
- Drive time: full points at 5 minutes, falling to zero at 60.
- Continuity: full points if the caregiver has seen the patient three or more times.
- Overtime: full points if the visit keeps her under 40 hours that week; falls with each overtime hour.
- Reliability: full points with no call-outs, zero at a 10% call-out rate.
Worked example: one open RN visit
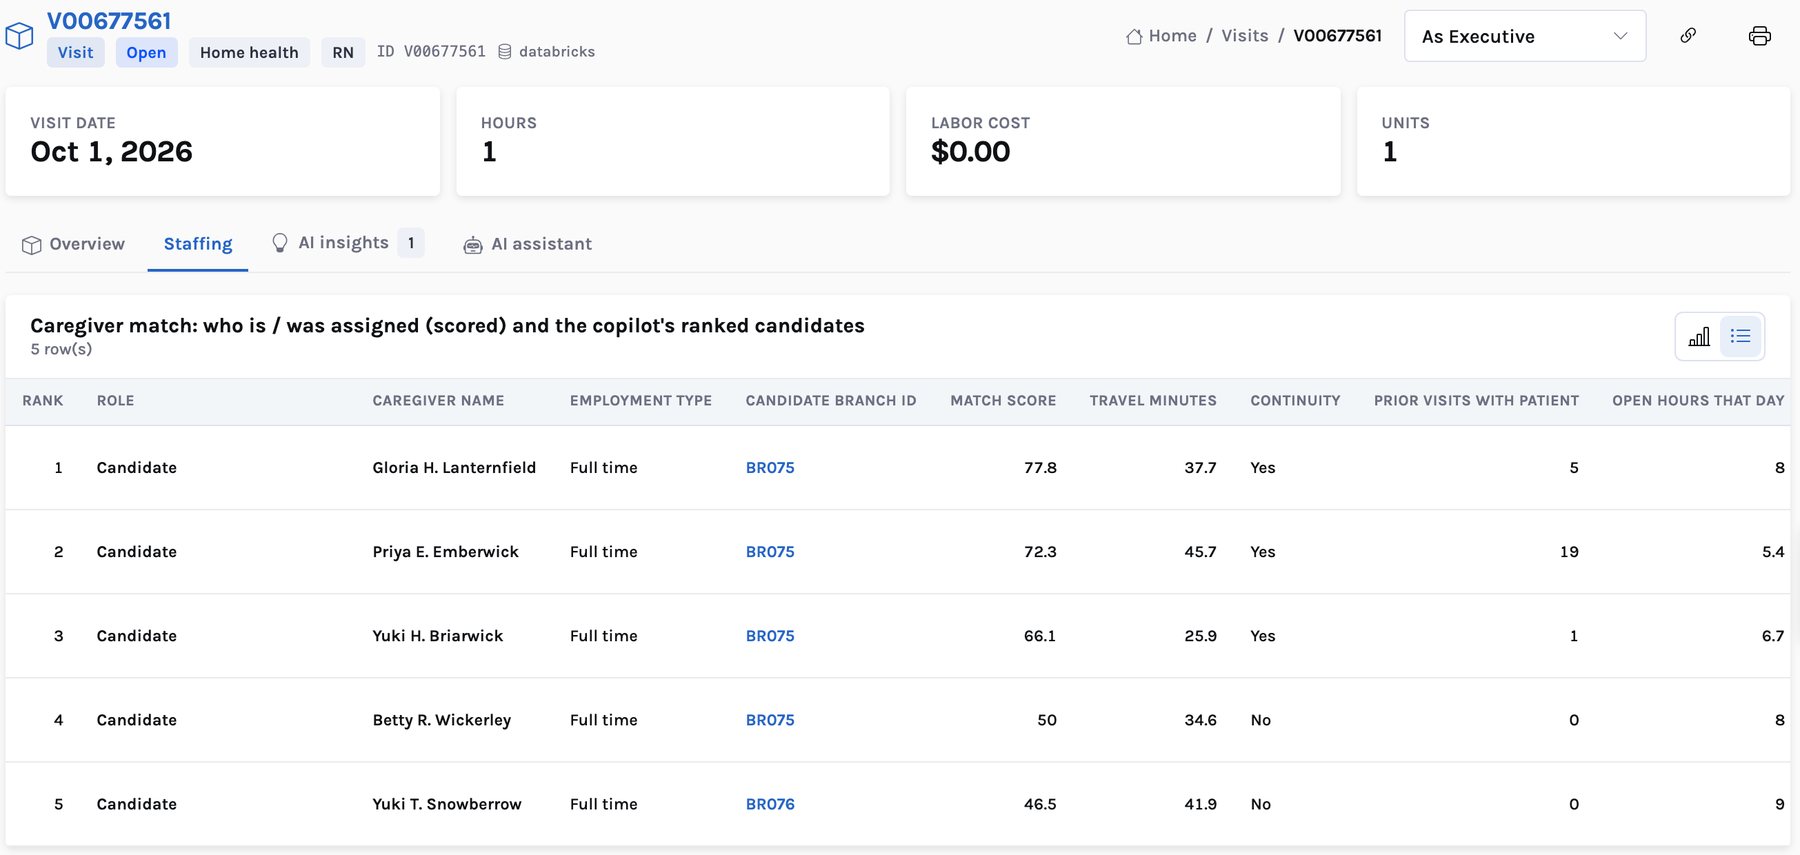
An RN visit on 1 October at a home-health branch in Cuyahoga County, Ohio, has no caregiver. These are the copilot's five candidates, as it wrote them. All names are synthetic.
| Rank | Caregiver | Why, in the copilot's words | Score |
|---|---|---|---|
| 1 | Gloria H. Lanternfield | 38 min away · has seen the patient 5 times · 1h scheduled that week, no overtime · 1.0% call-outs | 77.8 |
| 2 | Priya E. Emberwick | 46 min away · has seen the patient 19 times · 6h scheduled, no overtime · 1.2% call-outs | 72.3 |
| 3 | Yuki H. Briarwick | 26 min away · has seen the patient once · 3h scheduled, no overtime · 0.4% call-outs | 66.1 |
| 4 | Betty R. Wickerley | 35 min away · new to the patient · 2h scheduled, no overtime · 0.8% call-outs | 50.0 |
| 5 | Yuki T. Snowberrow | 42 min away (neighboring branch) · new to the patient · no overtime · 0.0% call-outs | 46.5 |
The nearest nurse is ranked third. The top candidate is 12 minutes further away but has already seen the patient five times, and continuity counts. Her score adds up as: drive 14.2 of 35 (38 minutes) + continuity 30 of 30 + overtime 20 of 20 + reliability 13.6 of 15 = 77.8. The third candidate loses 20 continuity points for having seen the patient only once. A scheduler who disagrees can see exactly why, and choose differently.
Protecting fragile visits
An unstaffed visit is visible. A staffed visit that is about to be missed is not. The copilot also scores all 25,765 staffed visits in the look-ahead for the risk of a miss — driven mostly by the caregiver's recent call-outs, a patient who has missed visits lately, long drives and a caregiver new to the patient — and lines up backups for the 131 visits with a miss risk of 12% or more. 238 visits are in the high band.
What this is, and what it is not
Home Care 360 recommends; it does not schedule. The copilot proposes and the scheduler assigns in your scheduling system. In the demo, the match score, the miss risk and the 60% recapture rate are transparent rules and assumptions over synthetic data, not models trained on real outcomes. In a pilot they are calibrated on your own history, and the readout compares referrals declined for staff and the look-ahead fill rate in a pilot region against a control region.
The next post covers the other half of the supply problem: keeping the caregivers you hire. The Home Care 360 page shows the rest of the product.
Source. 1. CMS, CY2026 Home Health Prospective Payment System final rule (CMS-1828-F), 90 FR 55342, 2 December 2025: national, standardized 30-day period payment $2,038.22 for agencies that report quality data. The demo prices its synthetic episodes from this rate.
Home Care 360: grow admissions, fill every visit and keep your caregivers
Where the value is, the AI layer, the CMS benchmark, the lakehouse architecture and the 90-day pilot, for CIO, COO and CFO leadership.